Non-combustion electric supply more than 36% of total in fourth week of 2022
2022 week 04 US electric power supply review . . . non-combustion sources down more than 2% compared to previous week.
Electric Power Supply Review
U.S. contiguous 48 States
January 22-28, 2022
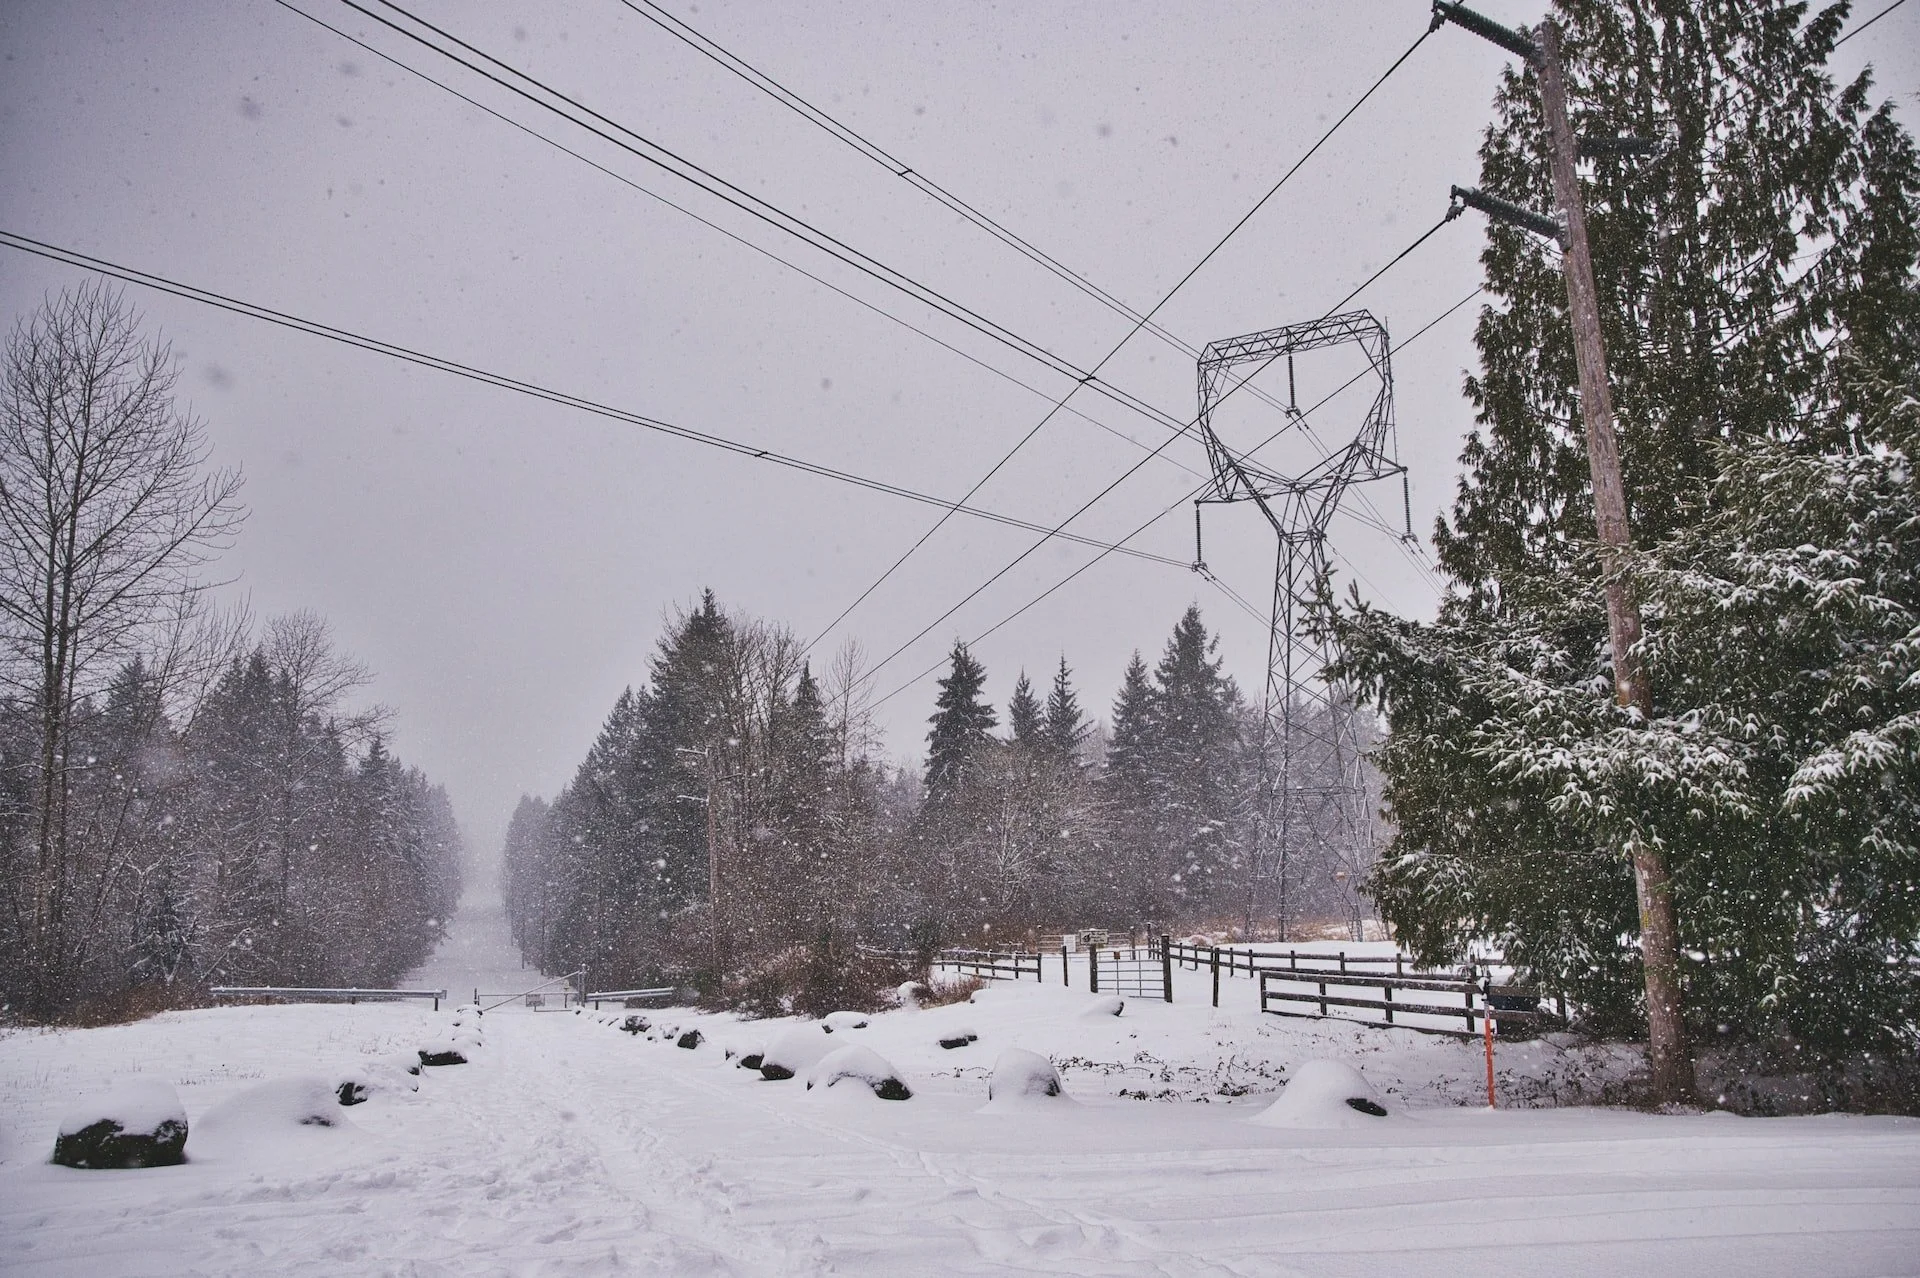
Photo by Marco Bicca on Unsplash near Duvall, Washington
February 17, 2021.
Quick summary
all non-combustion
wind, solar, nuclear and hydroelectric combined supplied 36.33% of total electric power generated.
solar electric
2.05% of total electric energy generated in the period.
windpower
8.72% of total electric energy generated in the period.
Note: data source for all charts is the U.S. Energy Information Administration (EIA) Hourly Electric Grid Monitor. See APPENDIX for explanation of data quality.
U.S. electric power supply: contiguous 48 States
January 22-28, 2022
Natural gas and coal combustion contributed the largest share of electric generation for the January 22-28, 2022 period. Nuclear power produced slightly less than one-fifth of the total. Windpower supplied more than four times the electric output of solar.
Total electric energy generated
84,420,525 MegaWatthours (MWH)
Non-combustion energy sources
36.33% of total
(wind, solar, nuclear and hydroelectric)
Total electric generation from combustion and non-combustion energy sources: January 22 -28, 2022. Linecurrents.live chart, U.S. Energy Information Administration (EIA) Hourly Electric Grid Monitor data.
Hourly electric generation to meet consumers consumption demand reveals the morning consumption peak was higher than the evening peak. Nuclear generation output remained nearly constant for the period. Grid operators adjusted coal and natural gas generation to follow peaks and valleys of consumers demand, and to adjust for variable wind turbine and solar array output.
Daily totals of non-combustion electric energy sources were varied only slightly during the period.
Solar electric
The largest U.S. solar electric sources are in Texas (Central time zone) and California (Pacific time zone).
Hourly data from each region outside of the Eastern Time Zone is adjusted to Eastern. The largest solar producing region is California, where 12:00 noon Pacific Time is 3:00 PM Eastern. Texas is the second-highest solar electric producer, where 12:00 noon Central Time is 1:00 PM Eastern. Charts are affected by use of Eastern time base, with solar energy shifted to the right.
U.S. contiguous 48 States hourly electric generation from solar energy January 22-28, 2022. Linecurrents.live chart, U.S. EIA Hourly Electric Grid Monitor data.
California region produced the most solar electric energy for the 7-day period
U.S. contiguous 48 States solar electric energy regional comparison January 22-28, 2022. Linecurrents.live chart, U.S. EIA Hourly Electrtic Grid Monitor data
Windpower
Maximum hourly windpower outputs occurred in late evenings and overnight, complementing daytime solar. January 24 showed the best all-day performance.
U.S. contiguous 48 States hourly electric generation from wind energy: January 22-28, 2022. Linecurrents.live chart, U.S. EIA Hourly Electric Grid Monitor data.
Midwest region produced the most windpower for the 7-day period.
U.S. contiguous 48 States windpower regional comparison January 22-28, 2022. Linecurrents.live chart, U.S. EIA Hourly Electric Grid Monitor data
Regional windpower
United States regions defined by U.S. Energy Information Administration (EIA). Southeast lacks significant windpower generation and is not included in this regional analysis. Map adapted from U.S. EIA Hourly Electric Grid Monitor . . . colors and region labels added by Linecurrents.live.
Hourly windpower for January 22-28, 2022 is shown in regional charts. Times are local. Northwest, Southwest and Mid-Atlantic regions span two time zones


January 22-28 regional
windpower highlights
Most consistent
Northwest except January 26
Most underperforming
California
Most reliable 24-hour pattern
None
Hourly electric supply:
non-combustion vs. total all sources
Morning and evening peaks, afternoon and overnight valleys. Electric power generation in the followed this regular pattern in the U.S 48 contiguous States . . . January 22-28, 2022. Local utility and regional power pool organizations adjust combustion and hydroelectric power output to match consumers’ demand, and to compensate for varying wind and solar electric sources.
Charts show hourly totals of the four non-combustion generating sources collected by U.S. EIA, and total of all electric energy sources including combustion and geothermal.
Solar electric supply ramps up after the morning consumption/generation peak demand, and is declining or offline during the evening peak.


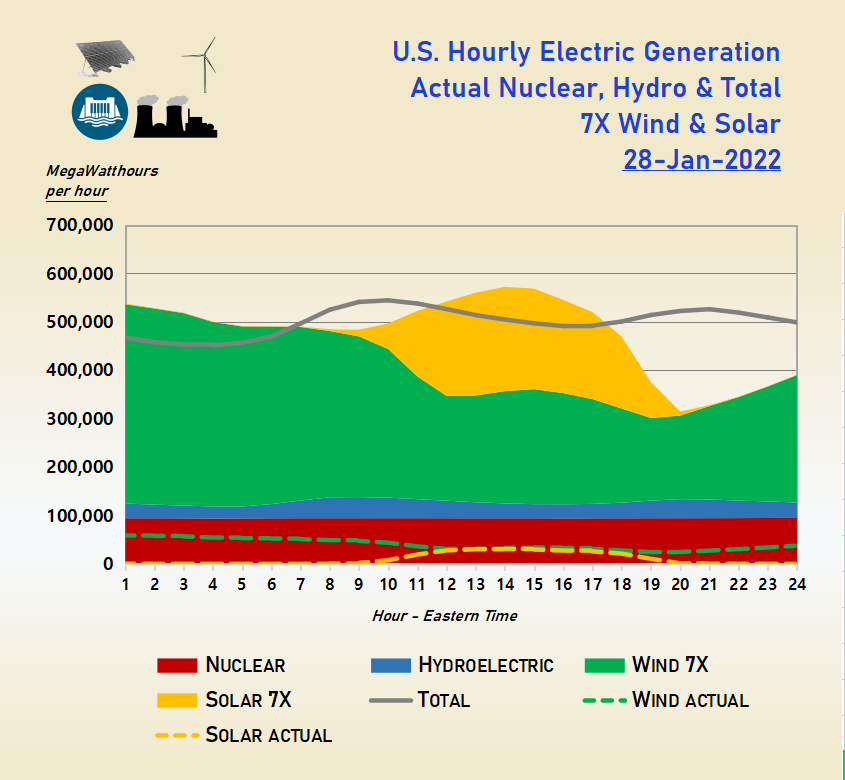
The next section examines the hourly impact of removing all combustion electric supply from the U.S. contiguous 48 States’ three electric transmission grids, and increasing wind and solar electric generating capacity by a factor of seven. Results assume that new wind and solar electric plants are at existing sites, and perform the same as older units. Other new sites, including off-shore windpower, may produce daily or seasonal production patterns which differ from existing sites.
Daily electric supply if combustion sources are eliminated and wind/solar increased 7X
The following analysis illustrates scale-up of existing U.S. wind and solar electric generating capacity, and elimination of combustion generation sources. Nuclear and hydroelectric capacity now in service remain changed. Charts illustrate this scenario for each day January 22-28, 2022.
Total actual U.S. hourly generated electric energy supply is represented in the following charts by a gray line:
includes all electric generating sources: wind, solar, hydroelectric, nuclear, natural gas, coal, petroleum, geothermal..
is an estimate of U.S. electric consumers’ hourly consumption.
does not include electric energy imports or exports with Canada and Mexico via electric transmission lines.
Actual wind and solar hourly electric supply are shown as dashed green and yellow lines.
Arrows in the first 24-hour chart illustrate possible shifting of excess wind or solar stored in batteries or other systems to fill later shortages when consumer electric demand exceeds variable weather-dependent electric supply.


Appendix
data source
U.S. Energy Information Administration (EIA) Hourly Electric Grid Monitor is the source for data for this report. EIA provides this disclaimer:
Disclaimer: The information submitted by reporting entities is preliminary data and is made available "as-is" by EIA. Neither EIA nor reporting entities are responsible for reliance on the data for any specific use.
Factors which may affect future electric power transfers among U.S. regions
inadequacy of existing transmission grid to move large amounts of electric power between regions.
new transmission line construction delays due to right-of-way acquisition and State/local jurisdiction issues.
States, Balancing Authorities and Regions priorities for use of potential excess variable wind/solar electric energy, such as:
a) export electric energy to other Balancing Authorities or Regions.
b) store electric energy, instead of export, for later consumption.
c) consume electric energy immediately produced for electric transportation, water and indoor space heating, cold storage for air-conditioning, and other uses for which consumption may be controlled to synchronize with variable energy sources production.
d) hydroelectric supply replacement due to Western U.S. drought.
e) nuclear electric supply replacement due to plant closures.

Strong performance for both wind and solar energy January 15, 18 & 19
2022 week 03 US electric power supply review . . . non-combustion sources supplied 38.96% of total electric energy generated.
Electric Power Supply Review
U.S. contiguous 48 States
January 15-21, 2022
Photo by Dan Meyers on Unsplash near The Dalles, Oregon. Published May 29, 2019. Windpower was most reliable and consistent in the northwest United States during the third week of 2022.
Quick summary
non-combustion
wind, solar, nuclear and hydroelectric combined supplied 38.96% of total electric power generated.
adding wind and solar energy capacity 7X existing would be adequate to supply consumer hourly consumption January 18-19 without battery storage or backup fossil fuel combustion generation.
solar electric
1.74% of total electric energy generated in the period.
windpower
11.04% of total electric energy generated in the period.
reduced output January 16-17, 20.
Note: see APPENDIX for discussion of EIA data sources and trans-grid electric power transfers.
U.S. hourly electric power supply - contiguous 48 States
January 15-21, 2022
Natural gas and coal combustion contributed the largest share of electric generation for the January 15-21, 2022 period. Nuclear power produced about one-fifth of the total. Windpower supplied more than five times the electric output of solar.
Total electric energy generated
82,845,172 MegaWatthours (MWH)
Non-combustion energy sources
38.96% of total
(wind, solar, nuclear and hydroelectric)
U.S. contiguous 48 States hourly electric generation from combustion and non-combustion energy sources: January 15-21, 2022. U.S. Energy Information Administration (EIA) Hourly Grid Monitor chart created from Linecurrents.live custom query. Times are Eastern zone.
Total electric generation from combustion and non-combustion energy sources: January 15 -21, 2022. Linecurrents.live chart, U.S. EIA data.
Solar electric
The largest U.S. solar electric sources are in Texas (Central time zone) and California (Pacific time zone). Daily solar production maximums are shifted in the chart due to chart times are Eastern zone.
maximum day
January 18
247,161 MWHminimum day
January 15
150,777 MWH7-day total
1,444,951 MWHdaily high-to-low
variation: 39.00%
U.S. contiguous 48 States hourly electric generation from solar energy January 15-21, 2022. Times are Eastern zone. Linecurrents.live chart, U.S. EIA Hourly Grid Monitor data.
Windpower
Mid’-day January 10 and most hours January 12-13 were periods of reduced windpower generation. These wind slowdowns caused an increase in combustion electric generation - (see next two sections, below). No daily pattern of repeating daily highs and lows at regular times of day developed during the 7 days.
maximum day
January 19
1,728,567 MWHminimum day
January 16
934,312 MWH7-day total
9,142,183 MWHdaily high-to-low
variation: 45.95%
U.S. contiguous 48 States hourly electric generation from wind energy: January 15-21, 2022. Times are Eastern zone. Linecurrents.live chart, U.S. EIA Hourly Grid Monitor data.
Regional windpower
United States regions defined by U.S. Energy Information Administration (EIA). Southeast lacks significant windpower generation and is not included in this regional analysis. Map adapted from U.S. EIA Hourly Electric Grid Monitor . . . colors and region labels added by Linecurrents.live.


Hourly windpower for January 15-21, 2022 is shown in regional charts. Chart times are local. Northwest, Southwest and Mid-Atlantic regions span two time zones
- - -
January 15-21 regional
windpower highlights
Most consistent
Northwest except January 19
Most underperforming
California
Most reliable daily cycle
None
The next section examines the hourly impact of removing all combustion electric supply from the U.S. contiguous 48 States’ three electric transmission grids, and increasing wind and solar electric generating capacity by a factor of seven. Results assume that new wind and solar electric plants are at existing sites, and perform the same as older units. Other new sites, such as off-shore windpower, may produce daily or seasonal production patterns which differ from existing sites.
Daily electric supply if combustion sources are eliminated and wind/solar increased 7X
The following analysis illustrates scale-up of existing U.S. wind and solar electric generating capacity, and elimination of combustion generation sources. Nuclear and hydroelectric capacity now in service remain changed. Charts illustrate this scenario for each day January 15-21, 2022.
Total actual U.S. hourly generated electric energy supply is represented in the following charts by a gray line:
includes all electric generating sources: wind, solar, hydroelectric, nuclear, natural gas, coal, petroleum and other.
is an estimate of U.S. electric consumers’ hourly consumption.
does not include electric energy imports or exports with Canada and Mexico via electric transmission lines.
Actual wind and solar hourly electric supply are shown as dashed green and yellow lines.
Arrows indicate when excess wind or solar stored in batteries or other systems could be released to fill gaps between consumer electric demand and variable weather-dependent supply. No arrows mean supply is adequate for the day, or storage capacity of 4-6 hours was exhausted in previous days.
Earlier charts of actual hourly wind and solar energy production show strong performance from both sources January 18-19. In the 7X wind and solar scenario, charts show these days to have more than adequate electric supply to replace current fossil-fuel generation without energy storage to fill energy supply shortages.


Appendix
data source
U.S. Energy Information Administration (EIA) Hourly Electric Grid Monitor is the source for data for this report. EIA provides this disclaimer:
Disclaimer: The information submitted by reporting entities is preliminary data and is made available "as-is" by EIA. Neither EIA nor reporting entities are responsible for reliance on the data for any specific use.
Factors which may affect future electric power transfers among U.S. regions
inadequacy of existing transmission grid to move large amounts of electric power between regions.
new transmission line construction delays due to right-of-way acquisition and State/local jurisdiction issues.
States, Balancing Authorities and Regions priorities for use of potential excess variable wind/solar electric energy, such as:
a) export electric energy to other Balancing Authorities or Regions.
b) store electric energy, instead of export, for later consumption.
c) consume electric energy immediately produced for electric transportation, water and indoor space heating, cold storage for air-conditioning, and other uses for which consumption may be controlled to synchronize with variable energy sources production.
d) hydroelectric supply replacement due to Western U.S. drought.
e) nuclear electric supply replacement due to plant closures.

Windpower supplied more than 5X compared to solar in 2nd week 2022
Wind, solar, nuclear and hydroelectric combined supplied 40.26% of total electric power generated.
Electric Power Supply Review
Hourly & Daily
U.S. contiguous 48 States
January 8-14, 2022
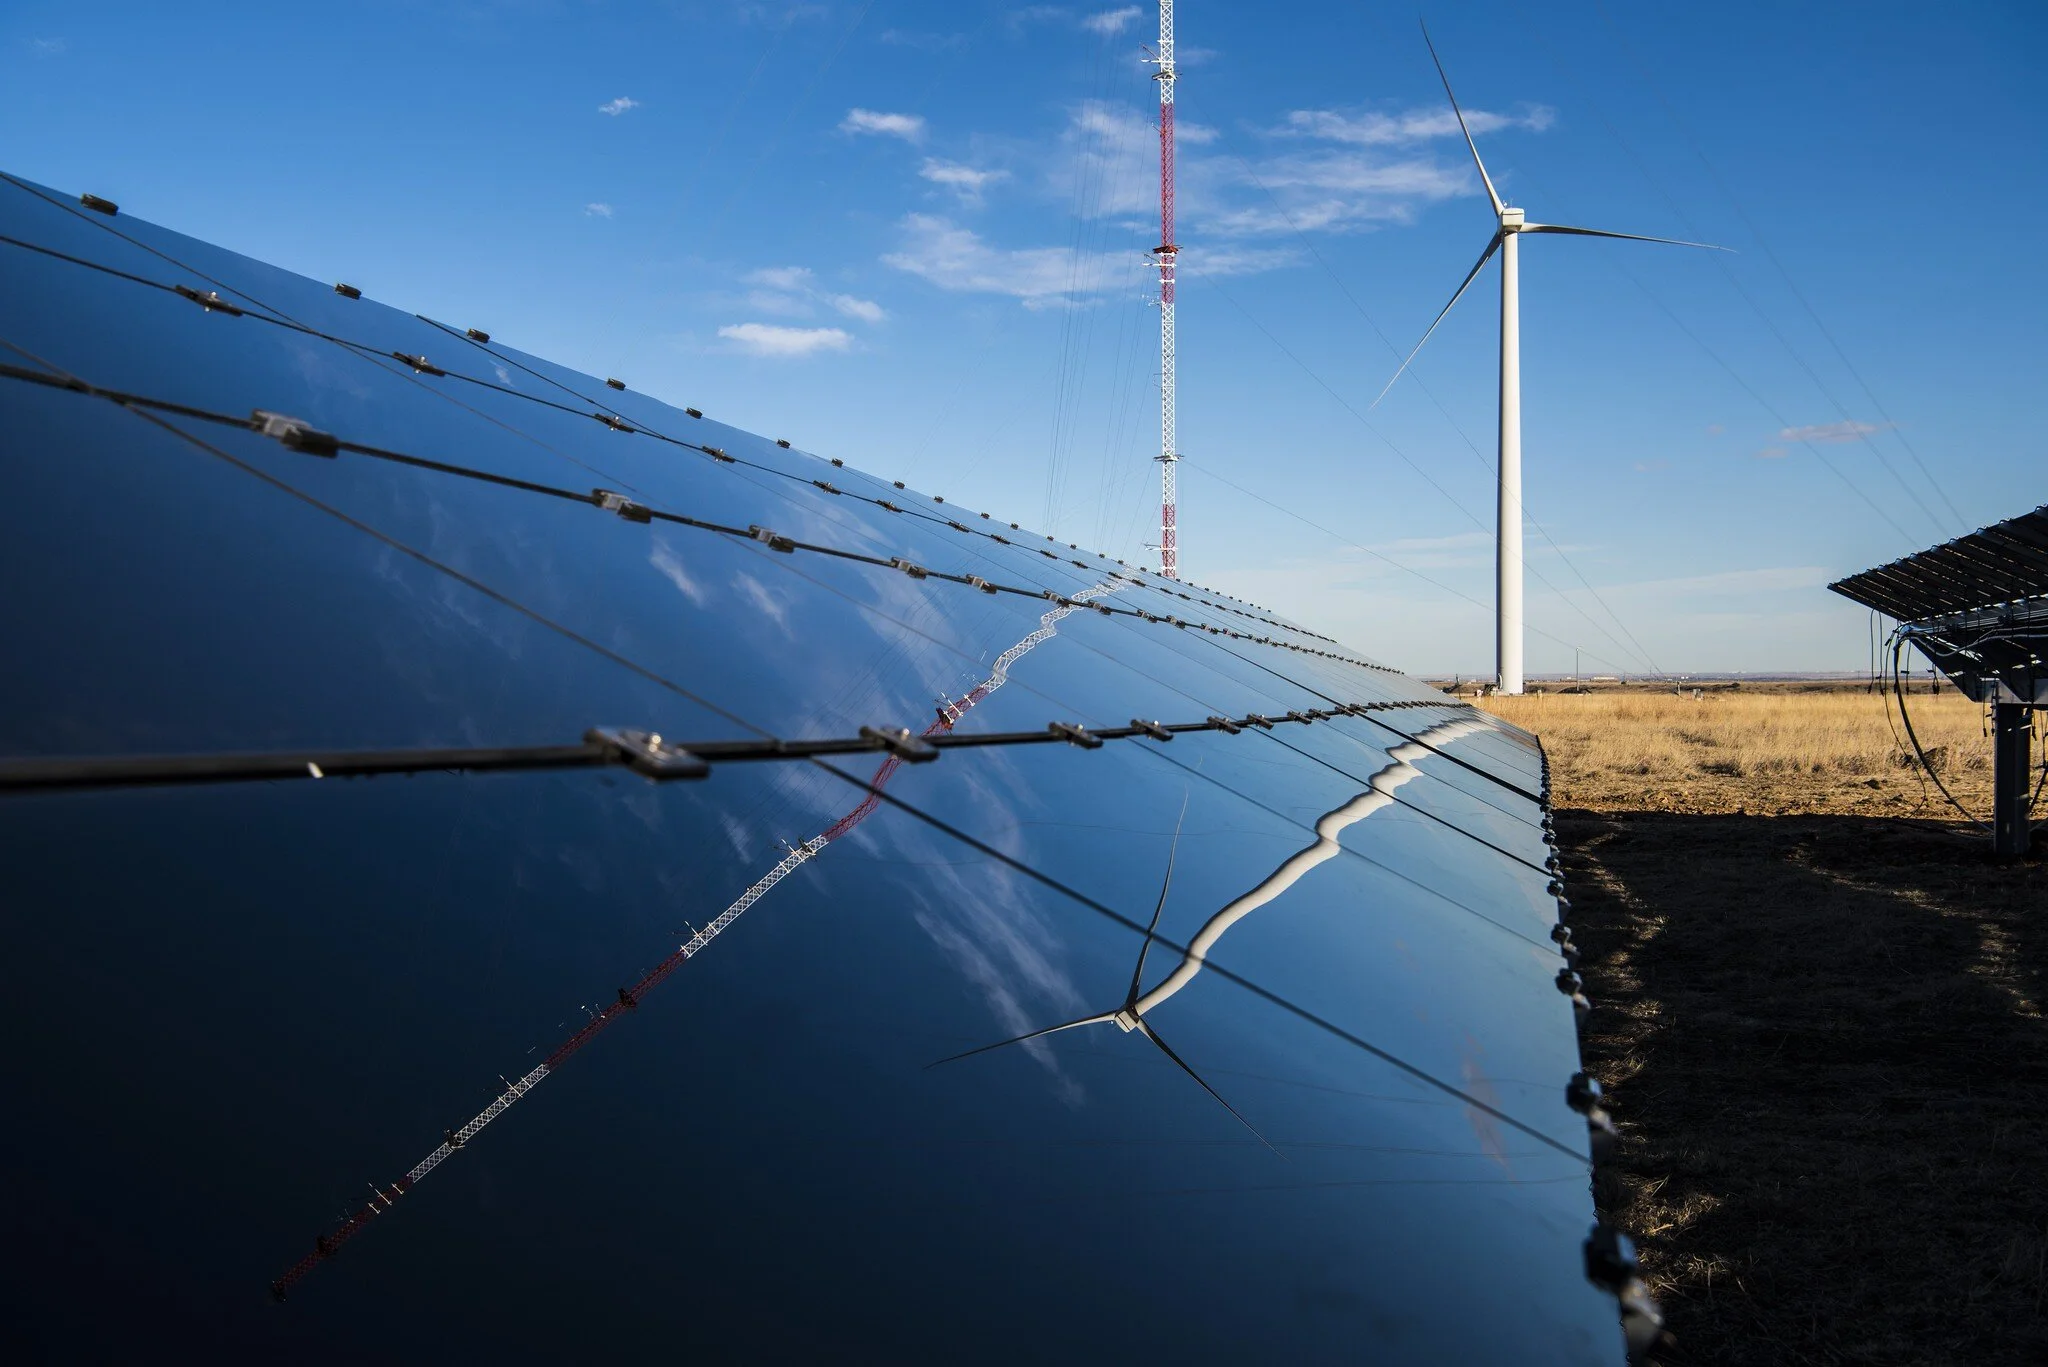
Huerfano River Wind project near Walsenburg, Colorado. Photo by Jeffrey Beall - Own work, CC BY 4.0, https://commons.wikimedia.org/w/index.php?curid=60978884. Related: Colorado's Award-Winning Windpower Electric Co-ops
Quick summary
non-combustion
wind, solar, nuclear and hydroelectric combined supplied 40.26% of total electric power generated.
adding wind and solar energy capacity 7X existing would be adequate to supply consumer hourly consumption some days without battery storage or backup fossil fuel combustion generation.
solar electric
1.99% of total electric energy generated in the period.
windpower
10.82% of total electric energy generated in the period.
reduced output January 10, 12-13.
Note: see APPENDIX for discussion of EIA data sources and trans-grid electric power transfers.
U.S. hourly electric power supply - contiguous 48 States
January 8-14, 2022
Natural gas and coal combustion contributed the largest share of electric generation for the January 8-14, 2022 period. Nuclear power produced about one-fifth of the total. Windpower supplied more than five times the electric output of solar.
Total electric energy generated
79,377,045 MegaWatthours (MWH)
Non-combustion energy sources
40.26% of total
(wind, solar, nuclear and hydroelectric)
U.S. contiguous 48 States hourly electric generation from combustion and non-combustion energy sources: January 8-14, 2022. U.S. Energy Information Administration (EIA) Hourly Grid Monitor chart created from Linecurrents.live custom query. Times are Eastern zone.
Total electric generation from combustion and non-combustion energy sources: January 8 -14, 2022. Linecurrents.live chart, U.S. EIA data.
Solar electric
The largest U.S. solar electric sources are in Texas (Central time zone) and California (Pacific time zone). Daily solar production maximums are shifted in the chart due to chart times are Eastern zone.
A late-day spike in apparent solar electric generation January 13 is due to data from Florida. Cause is unknown.
maximum day
January 11
251,284 MWH
minimum day
January 9
194,878 MWH
7-day total
1,576,331 MWH
daily high-to-low
variation: 22.45%
U.S. contiguous 48 States hourly electric generation from solar energy January 8-14, 2022. Times are Eastern zone. Linecurrents.live chart, U.S. EIA Hourly Grid Monitor data.
Windpower
Mid’-day January 10 and most hours January 12-13 were periods of reduced windpower generation. These wind slowdowns caused an increase in combustion electric generation - (see next two sections, below). No daily pattern of repeating daily highs and lows at regular times of day developed during the 7 days.
maximum day
January 8
1,727,394 MWH
minimum day
January 13
696,786 MWH
7-day total
8,588,681 MWH
daily high-to-low
variation: 59.66%
U.S. contiguous 48 States hourly electric generation from wind energy: January 8-14, 2022. Times are Eastern zone. Linecurrents.live chart, U.S. EIA Hourly Grid Monitor data.
All non-combustion sources
U.S. contiguous 48 States daily electric generation from wind, solar, hydroelectric and solar energy sources: January 8-14, 2022. Times are Eastern zone. U.S. EIA Hourly Grid Monitor data and chart from Linecurrents.live custom query.
Nuclear generation supplied the largest amount of non-combustion electric energy in the U.S. 48 contiguous States January 8-14, 2022. Windpower was the most variable from day to day.
Regional windpower
January 8-14 regional
windpower highlights
Most consistent
Northwest
Most underperforming
California
Most reliable daily cycle
None
Hourly windpower for January 8-14, 2022 is shown in regional charts (below). Chart times are local. Northwest and Mid-Atlantic regions span two time zones
United States regions defined by U.S. Energy Information Administration (EIA). Southeast lacks significant windpower generation and is not included in this regional analysis. Map adapted from U.S. EIA Hourly Electric Grid Monitor . . . colors and region labels added by Linecurrents.live.


The next section examines the hourly impact of removing all combustion electric supply from the U.S. contiguous 48 States’ three electric transmission grids, and increasing wind and solar electric generating capacity by a factor of seven. Results assume that new wind and solar electric plants are at existing sites, and perform the same as older units. Other new sites, such as off-shore windpower, may produce daily or seasonal production patterns which differ from existing sites.
Daily electric supply if combustion sources are eliminated and wind/solar increased 7X
The following analysis illustrates scale-up of existing U.S. wind and solar electric generating capacity, and elimination of combustion generation sources. Nuclear and hydroelectric capacity now in service are not changed.
Total actual U.S. hourly generated electric energy supply is represented in the following charts by a gray line:
includes all electric generating sources: wind, solar, hydroelectric, nuclear, natural gas, coal, petroleum and other.
is an estimate of U.S. electric consumers’ hourly consumption.
does not include electric energy imports or exports with Canada and Mexico via electric transmission lines.
Actual wind and solar hourly electric supply are shown as dashed green and yellow lines.
Arrows indicate when excess wind or solar stored in batteries or other systems could be released to fill gaps between consumer electric demand and variable weather-dependent supply. No arrows mean supply is adequate for the day, or storage capacity of 4-6 hours was exhausted in previous days.


Appendix
data source
U.S. Energy Information Administration (EIA) Hourly Electric Grid Monitor is the source for data for this report. EIA provides this disclaimer:
Disclaimer: The information submitted by reporting entities is preliminary data and is made available "as-is" by EIA. Neither EIA nor reporting entities are responsible for reliance on the data for any specific use.
Factors which may affect future electric power transfers among U.S. regions
inadequacy of existing transmission grid to move large amounts of electric power between regions.
new transmission line construction delays due to right-of-way acquisition and State/local jurisdiction issues.
States, Balancing Authorities and Regions priorities for use of potential excess variable wind/solar electric energy, such as:
a) export electric energy to other Balancing Authorities or Regions.
b) store electric energy, instead of export, for later consumption.
c) consume electric energy immediately produced for electric transportation, water and indoor space heating, cold storage for air-conditioning, and other uses for which consumption may be controlled to synchronize with variable energy sources production.
d) hydroelectric supply replacement due to Western U.S. drought.
e) nuclear electric supply replacement due to plant closures.

U.S. windpower declined a few days in 1st week of 2022, natural gas combustion increased
Non-combustion energy sources — wind, solar, nuclear and hydroelectric — combined supplied 41.92% of total electric power generated in the United States contiguous 48 States.
Electric Power Supply Review
Hourly & Daily
January 1-7, 2022
Lubbock County, TX, USA
Photo by Pete Alexopoulos on Unsplash
Quick summary
all non-combustion
wind, solar, nuclear and hydroelectric combined supplied 41.92% of total electric power generated . . . contribution of geothermal electric is unknown due to lack of this category in U.S. EIA data collection
solar electric
1.85% of total electric energy generated in the period
windpower
12.16% of total electric energy generated in the period
a 28-hour slowdown January 2-3
Note: see APPENDIX for discussion of EIA Data Source and trans-grid electric power transfers.
U.S. hourly electric power supply
January 1-7, 2022
Natural gas and coal combustion contributed the largest share of electric generation for the January 1-7, 2022 period.
Non-combustion energy sources — wind, solar, nuclear and hydroelectric — combined supplied 41.92% of total electric power generated in the United States contiguous 48 States during the period.
Hourly electric generation from combustion and non-combustion energy sources - January 1-7, 2022. U.S. Energy Information Administration (EIA) Hourly Grid Monitor chart created from Linecurrents.live custom query. Times are Central zone.
Total electric generation from combustion and non-combustion energy sources - January 1-7, 2022. Linecurrents.live chart, U.S. EIA data.
Solar electric
The largest U.S. solar electric sources are in Texas (Central time zone) and California (Pacific time zone). Daily solar production maximums are shifted in the chart due to chart times are Eastern zone.
Hourly electric generation from solar energy sources - January 1-7, 2022. Times are Eastern zone. Linecurrents.live chart, U.S. EIA Hourly Grid Monitor data.
Windpower
Noon January 2 through 4:00 PM January 3 was a period of extended reduced windpower generation. A similar slowdown occurred between 3:00 PM January 6 to 1:00 PM January 7.
Hourly electric generation from wind energy sources - January 1-7, 2022. Times are Eastern zone. Linecurrents.live chart, U.S. EIA Hourly Grid Monitor data.
Natural gas and coal
Natural gas combustion increased in days when windpower production declined. Daily up/down pattern of combustion fuel consumption coincides with aggregated consumers’ hourly electric demands.
Hourly electric generation from coal, natural gas and wind energy sources - January 1-7, 2022. Times are Eastern zone. U.S. EIA Hourly Grid Monitor data and chart from Linecurrents.live custom query.
Combined wind and solar electric
Combined wind and solar electric consistency was affected by wind reductions January 2-3 and January 6-7.
Hourly electric generation from solar and wind energy sources - January 1-7, 2022. U.S. EIA Hourly Grid Monitor chart created from Linecurrents.live custom query. Times are Central zone.
Regional windpower
Hourly windpower for January 1 - 7, 2022 is shown in regional charts (below). All chart times are Eastern Zone.
Regional patterns and irregularities
Northwest
Early morning maximums January 2, 3, 4.
Sharp decline early morning January 6.
California
No pattern.
Low production January 1-3 and January 5-6.
Texas
No pattern.
Low production January 2 and January 7.
Central
No pattern.
Midwest
No pattern.
Low production January 2 and January 7.
West and central United States regions defined by U.S. Energy Information Administration (EIA). Texas, California, Midwest and Central are regions of greatest U.S. windpower production. Map adapted from U.S. EIA Hourly Electric Grid Monitor . . . colors and region labels added by Linecurrents.live.


The next section examines the hourly impact of removing all combustion electric supply from the U.S. contiguous 48 States’ three electric transmission grids, and increasing wind and solar electric generating capacity by a factor of seven. Results assume that new wind and solar electric plants are at existing sites, and perform the same as older units. Other new sites, such as off-shore windpower, may produce daily or seasonal production patterns which differ from existing sites.
Daily electric supply if combustion sources are eliminated and wind/solar increased 7X
The following analysis illustrates scale-up of existing U.S. wind and solar electric generating capacity, and elimination of combustion generation sources. Nuclear and hydroelectric capacity now in service are not changed.
Total actual U.S. hourly generated electric energy supply is represented in the following charts by a gray line:
includes all electric generating sources: wind, solar, hydroelectric, nuclear, natural gas, coal, petroleum and other.
is an estimate of actual U.S. electric consumers’ hourly consumption.
does not include electric energy imports or exports with Canada and Mexico via electric transmission lines.
Actual wind and solar hourly electric supply are shown as dashed lines. Color-shaded areas represent hourly wind and solar increased by a factor of 7 from actual.
Arrows indicate when excess wind or solar stored in batteries or other systems could be released to fill gaps between consumer electric demand and variable weather-dependent supply. No arrows mean supply is adequate for the day, or energy storage capacity was exhausted in previous days.


Appendix
data source
U.S. Energy Information Administration (EIA) Hourly Electric Grid Monitor is the source for data for this report. EIA provides this disclaimer:
Disclaimer: The information submitted by reporting entities is preliminary data and is made available "as-is" by EIA. Neither EIA nor reporting entities are responsible for reliance on the data for any specific use.
Factors which may affect future electric power transfers among U.S. regions
inadequacy of existing transmission grid to move large amounts of electric power between regions.
new transmission line construction delays due to right-of-way acquisition and State/local jurisdiction issues.
States, Balancing Authorities and Regions priorities for use of potential excess variable wind/solar electric energy, such as:
a) export electric energy to other Balancing Authorities or Regions.
b) store electric energy, instead of export, for later consumption.
c) consume electric energy immediately produced for electric transportation, water and indoor space heating, cold storage for air-conditioning, and other uses for which consumption may be controlled to synchronize with variable energy sources production.
d) hydroelectric supply replacement due to Western U.S. drought.
e) nuclear electric supply replacement due to plant closures.

Non-combustion electric sources nearly 40% of total electric power generated in late September 2021
Nuclear energy was the biggest source of U.S. non-combustion electricity . . . September 22-28, 2021
Electric Power Supply Review
Hourly & Daily
September 22 - 28, 2021
United States regions of greatest windpower
Quick summary
windpower
10.21% of total electric energy generated in the period
strongest in late evening and early A.M. hours most days
high-to-low daily totals differed by 37.8%
solar electric
2.92% of total electric energy generated in the period
high-to-low daily totals differed by 22.4%
all non-combustion
wind, solar, nuclear and hydroelectric combined supplied 39.7% of total electric power generated
Note: see APPENDIX for discussion of Time Zones, Data Source, and Transmission Access
U.S. hourly electric power supply
September 22-28, 2021
Natural gas and coal combustion contributed the largest share of electric generation for the September 22-28, 2021 period.
Non-combustion energy sources — wind, solar, nuclear and hydroelectric — combined supplied 39.75% of total electric power generated in the United States contiguous 48 States during the period.
Hourly electric generation from combustion and non-combustion energy sources. U.S. Energy Information Administration (EIA) Hourly Grid Monitor chart created from Linecurrents.live custom query. Times are Eastern zone.
Total electric generation from combustion and non-combustion energy sources. Linecurrents.live chart, U.S. EIA data.
Solar electric
The largest U.S. solar electric sources are Texas (Central time zone) and California (Pacific time zone). Daily solar production maximums in the chart are shifted 1 to 2 hours due to chart times are Eastern zone.
highest hourly maximum
329,318
Sept 25lowest hourly maximum
255,647
Sept 21minimum is less than maximum
22.4%
Hourly electric generation from solar energy sources. U.S. EIA Hourly Grid Monitor chart created from Linecurrents.live custom query. Times are Eastern zone.
Windpower
U.S. windpower generation produced late-evening or early-overnight highs in each of the seven days.
highest hourly maximum
1,278,491
Sept 26lowest hourly maximum
795,310
Sept 22minimum is less than maximum
37.8%
Hourly electric generation from wind energy sources. U.S. EIA Hourly Grid Monitor chart created from Linecurrents.live custom query. Times are Eastern zone.
Combined wind and solar electric
Wind and solar electric energy daily production were complementary. Solar electric production increased mid-mornings when windpower declined, and wind increased most evenings as solar declined.
The second chart in this section shows hourly wind and solar electric production combined. The resulting total is the top edge of the green area.
Hourly electric generation from solar and wind energy sources. U.S. EIA Hourly Grid Monitor chart created from Linecurrents.live custom query. Times are Eastern zone.
Hourly electric generation from solar and wind energy sources. U.S. EIA Hourly Grid Monitor chart created from Linecurrents.live custom query. Times are Eastern zone.
Regional windpower
West and central United States regions defined by U.S. Energy Information Administration (EIA). Texas, California, Midwest and Central, are regions of greatest U.S. windpower production. Map adapted from U.S. EIA Hourly Electric Grid Monitor . . . colors and region labels added by Linecurrents.live.
Hourly windpower for the September 22-28, 2021 period is shown in regional charts. All chart times are Eastern Zone.
Maximum windpower time of of day varied by region:
Northwest > no regular pattern
California > midnight + /- a few hours
Texas > midnight + /- a few hours, except Sept 23
Central > midnight + /- a few hours, except Sept 23 and 24
Midwest > no regular pattern


The next section examines the hourly impact of removing all combustion electric supply from the U.S. contiguous 48 States’ three electric transmission grids, and increasing wind and solar electric generating capacity by a factor of seven. Results assume that new wind and solar electric plants are at existing sites, and perform the same as older units. Other new sites, such as off-shore windpower, may produce daily or seasonal production patterns which differ from existing sites.
Daily electric supply if combustion sources are eliminated and wind/solar increased 7X
The following analysis illustrates scale-up for existing U.S. wind and solar electric generating capacity, and elimination of combustion generation sources. Nuclear and hydroelectric capacity now in service are not changed.
Total actual U.S. hourly generated electric energy supply is represented in the following charts by a gray line:
includes all electric generating sources: wind, solar, hydroelectric, nuclear, natural gas, coal, petroleum and other.
is an estimate of actual U.S. electric consumers’ hourly consumption.
does not include electric energy imports or exports via electric transmission lines with Canada and Mexico.
Color-shaded areas represent hourly wind and solar increased by a factor of 7 from actual. Actual wind and solar hourly electric supply are shown as dashed lines.
Arrows indicate times when excess wind or solar collected and collected in batteries or other systems storage systems may be released during electric supply shortages. If no excess supply is present, or hourly electric generation is adequate to supply consumption demand without storage, no arrows are shown.
Daily summary:
7 X wind & solar electric adequacy to replace combustion generation
Sept 22 - no
Sept 23 - yes
Sept 24 - yes
Sept 25 - yes
Sept 26 - yes
Sept 27 - yes
Sept 28 - yes


Appendix
time zones
Hourly charts in this report are based on Eastern time. Compared to local time at generator sites, hourly MWhr results are shifted to later in the day if the generator is not in the Eastern time zone:
1 hour: Central time zone - Midwest, Great Plains, Texas
2 hours: Mountain time zone
3 hours: Pacific time zone - Northwest, California
data source
U.S. Energy Information Administration (EIA) Hourly Electric Grid Monitor is the source for data for this report. EIA provides this disclaimer:
Disclaimer: The information submitted by reporting entities is preliminary data and is made available "as-is" by EIA. Neither EIA nor reporting entities are responsible for reliance on the data for any specific use.
transmission access
Factors which may affect future electric power transfers among U.S. regions
inadequacy of existing transmission grid to move large amounts of electric power between regions
new transmission line construction right-of-way acquisition and State/local jurisdiction issues
States, Balancing Authorities and regions priorities for use of potential excess variable wind/solar electric energy:
a) export to other BA’s or regions
b) store and consume with no export
c) consume electric energy when produced by electrification of transport, water and indoor space heating, and other fuel-switching to electric energyhydroelectric supply reduction due to drought
nuclear electric supply reduction due to plant closures
other

U.S. daily windpower supply varied 47% from high to low in mid’-September 2021
Big swing from highest to lowest windpower days across the U.S. in last week of summer.
U.S. Electric Power Supply Review
Hourly & Daily
September 15 - 21, 2021
U.S. States with the greater windpower production are shown in darker shades. Gray shading indicates no utility-scale wind turbine generators installed.
Quick summary
windpower
9.04% of total electric energy generated in the period
strongest in late evening and early A.M. hours most days
high-to-low daily totals differed 47%
solar electric
2.58% of total electric energy generated in the period
high-to-low daily totals differed 20%
all non-combustion
wind, solar, nuclear and hydroelectric combined supplied 35.25% of total electric power generated
Note: see APPENDIX for discussion of Time Zones, Data Source, and Transmission Access
U.S. hourly electric power supply
September 15-21, 2021
Natural gas and coal combustion contributed the largest share of electric generation for the September 15-21, 2021 period.
Non-combustion energy sources — wind, solar, nuclear and hydroelectric — combined supplied 35.25% of total electric power generated in the United States contiguous 48 States during the period.
Hourly electric generation from combustion and non-combustion energy sources. U.S. Energy Information Administration chart created from Linecurrents.live custom query. Times are Eastern zone.
Electric generation from combustion and non-combustion energy sources. Linecurrents.live chart, U.S. Energy Information Administration data.
Solar electric
Solar production maximums in the chart are shifted from 11 AM - 1 PM to 1 - 3 PM due to chart times are Eastern zone, and largest solar supplies are in Texas (Central) and California (Pacific).
Hourly electric generation from solar energy sources. U.S. Energy Information Administration chart created from Linecurrents.live custom query. Times are Eastern zone.
Windpower
Windpower generation produced late-evening and early-overnight highs in each of the seven days. Lowest windpower production day was September 15.
Hourly electric generation from wind energy sources. U.S. Energy Information Administration chart created from Linecurrents.live custom query. Times are Eastern zone.

Daily electric generation from wind energy sources. U.S. Energy Information Administration chart created from Linecurrents.live custom query. Times are Eastern zone.
Combined wind and solar electric
Wind and solar electric energy daily production were complementary. Solar electric production increased mid-mornings when windpower declined, and wind increased most evenings as solar declined.
The second chart in this section shows hourly wind and solar electric production combined. The resulting total is the top edge of the green area.
Hourly electric generation from solar and wind energy sources. U.S. Energy Information Administration chart created from Linecurrents.live custom query. Times are Eastern zone.
Hourly electric generation from solar and wind energy sources. U.S. Energy Information Administration chart created from Linecurrents.live custom query. Times are Eastern zone.
Regional windpower:
highest production overnight
Texas, the Midwest, Central/Great Plains, California and northwest States are regions of greatest windpower. Maximum electric energy generation usually occurred late-evenings or overnight in these zones September 15-21, 2021.
Northwest
Hourly wind electric generation September 15-21, 2021 did not reveal a daily pattern in the Northwest region. The top windpower producing States are Colorado, Washington, Oregon and Wyoming.
Hourly electric generation from wind energy sources. U.S. Energy Information Administration chart created from Linecurrents.live custom query. Times are Eastern zone.
California
Strongest windpower generation occurred evenings and overnight in California, except September 20 and 21. Lowest production occurred September 21.
Hourly electric generation from wind energy sources. U.S. Energy Information Administration chart created from Linecurrents.live custom query. Times are Eastern zone.
Texas
Texas is the highest windpower producing U.S. State. The late-evening and early-overnight maximum production pattern was consistent in all but the last day of the September 15-21 period.
Hourly electric generation from wind energy sources. U.S. Energy Information Administration chart created from Linecurrents.live custom query. Times are Eastern zone.
Central
Windpower generation in the Central region did not follow a consistent daily pattern September 15-21, 2021. Lowest daily production occurred September 18.
Hourly electric generation from wind energy sources. U.S. Energy Information Administration chart created from Linecurrents.live custom query. Times are Eastern zone.
Midwest
Hourly wind electric generation September 15-21, 2021 was highest in late evenings, except September 18 and 21.
Hourly electric generation from wind energy sources. U.S. Energy Information Administration chart created from Linecurrents.live custom query. Times are Eastern zone.
The next section examines the hourly impact of removing all combustion electric supply from the U.S. contiguous 48 States’ three electric transmission grids, and increasing wind and solar electric generating capacity by a factor of seven. Results assume that new wind and solar electric plants are at existing sites, and perform the same as older units. Other new sites, such as off-shore windpower, may produce daily or seasonal production patterns which differ from existing sites.
September 15, 2021
U.S. non-combustion & total hourly electric supply
Total U.S. hourly generated electric energy supply is shown by the gray line in the following series of daily charts. Total includes includes wind, solar, hydroelectric and nuclear shown by color areas, as well as natural gas, coal, petroleum and other. Electric energy imported via electric transmission lines from Canada and Mexico are not included.
The first chart shows actual hourly electric generation. September 15 was the lowest windpower production day of the 7-day period.
Linecurrents.live chart, U.S. Energy Information Administration data. Times are Eastern zone.
September 15, 2021
7X wind & solar
In the following examples, actual hourly U.S. contiguous 48-States solar and wind electric energy supplies are multiplied by 7. These expanded non-combustion sources, combined with existing nuclear and hydroelectric power generating capacity, would have been inadequate to replace combustion generation sources during all hours of September 15, due to low windpower supply.
Actual wind and solar hourly electric supply for September 15 are shown as dashed lines.
Linecurrents.live chart, U.S. Energy Information Administration data. Times are Eastern zone.
September 16, 2021
7X wind & solar
If wind and solar electric energy generation were each increased by 7 times, these sources combined with existing nuclear and hydroelectric power generating capacity would have been adequate to replace combustion generation nearly all hours September 16. Oversupply captured in batteries or other systems storage systems may be released during the brief evening real-time generation shortage.
Linecurrents.live chart, U.S. Energy Information Administration data. Times are Eastern zone.
September 17, 2021
7X wind & solar
A U.S electric supply consisting of existing nuclear and hydroelectric, plus 7X wind/solar, would have been inadequate to replace combustion electric generation day September 17, 2021. Actual solar and wind electric generation were lower compared to most days of the 7-day period.
Linecurrents.live chart, U.S. Energy Information Administration data. Times are Eastern zone.
September 18, 2021
7X wind & solar
The hypothetical 7X wind/solar plus existing nuclear and hydroelectric generating scenario would have would not have produced enough electric energy to match actual September 11, 2021 power supply which included coal and natural gas combustion sources.
Linecurrents.live chart, U.S. Energy Information Administration data. Times are Eastern zone.
September 19, 2021
7X wind & solar
The hypothetical 7X wind/solar plus existing nuclear and hydroelectric generating scenario would have been adequate to replace combustion electric generation in all hours September 19, 2021 — the 3rd highest day for wind actual electric generation of the 7-day period.
Linecurrents.live chart, U.S. Energy Information Administration data. Times are Eastern zone.
September 20, 2021
7X wind & solar
Another day in which 7X wind/solar plus existing nuclear and hydroelectric generating would have been adequate to replace combustion electric generation in all hours. September 20 was the highest day for wind actual electric generation of the 7-day period.
Linecurrents.live chart, U.S. Energy Information Administration data. Times are Eastern zone.
September 21, 2021
7X wind & solar
Actual windpower production remained relatively strong in the afternoon September 21, compared to the previous 6 days. Solar electric supply was the lowest of the 7-day period. In a U.S. electric grid enhanced with 7X wind/solar an no combustion generation, oversupply captured in batteries or other systems storage systems earlier in the day may be released during the evening generation shortage.
Linecurrents.live chart, U.S. Energy Information Administration data. Times are Eastern zone.
Appendix
time zones
Hourly charts in this report are based on Eastern time. Compared to local time at generator sites, hourly MWhr results are shifted to later in the day if the generator is not in the Eastern time zone:
1 hour: Central time zone - Midwest, Great Plains, Texas
2 hours: Mountain time zone
3 hours: Pacific time zone - Northwest, California
data source
U.S. Energy Information Administration (EIA) Hourly Electric Grid Monitor is the source for data for this report. EIA provides this disclaimer:
Disclaimer: The information submitted by reporting entities is preliminary data and is made available "as-is" by EIA. Neither EIA nor reporting entities are responsible for reliance on the data for any specific use.
transmission access
Factors which may affect future electric power transfers among U.S. regions
inadequacy of existing transmission grid to move large amounts of electric power between regions
new transmission line construction right-of-way acquisition and State/local jurisdiction issues
States, Balancing Authorities and regions priorities for use of potential excess variable wind/solar electric energy:
a) export to other BA’s or regions
b) store and consume with no export
c) consume electric energy when produced by electrification of transport, water and indoor space heating, and other fuel-switching to electric energyhydroelectric supply reduction due to drought
nuclear electric supply reduction due to plant closures
other
Blend of wind and solar electric reduces daily ups and downs of U.S. weather-dependent energy sources
More windpower and solar energy, added to existing hydroelectric and nuclear, could have powered the U.S. most days > Sept 8-14, 2021
Hourly & Daily U.S. Electric Power Supply Review
September 8 - 14, 2021
PV array and wind turbine generator at National Wind Technology Center (NWTC) located at National Renewable Energy Laboratory’s Flatirons Campus near Arvada, Colorado. U.S Department of Energy photo.
overnight windpower complemented daytime solar
consistent daily wind pattern in West and Central U.S.
less solar & wind Sept 8 & 9
Introduction
U.S. Energy Information Administration (EIA) Hourly Electric Grid Monitor is the source for data contained in the following charts. Please read EIA disclaimer in the Appendix.
Hourly charts in this report are based on Eastern time. Compared to local time at generator sites, hourly MWhr results are shifted to later in the day if the generator is not in the Eastern time zone:
1 hour: Central time zone - Midwest, Great Plains, Texas
2 hours: Mountain time zone
3 hours: Pacific time zone - Northwest, California
Factors which may affect future bulk electric power transgrid transfers are not considered in this report. See Appendix for a list of these potential conditions.
U.S. States monthly electric generating totals by energy source may be compared at Linecurrents.live link to Energy Information Administration interactive maps and charts.
September 8-14, 2021
U.S. hourly electric power supply summary
Natural gas and coal combustion contributed the largest share of electric generation for the September 8-14, 2021 period.
Non-combustion energy sources — wind, solar, nuclear and hydroelectric — combined supplied 35.37% of total electric power generated in the United States lower 48 States during the period.
Hourly electric generation from combustion and non-combustion energy sources. U.S. Energy Information Administration chart created from Linecurrents.live custom query. Times are Eastern zone.
Electric generation from combustion and non-combustion energy sources. Linecurrents.live chart, U.S. Energy Information Administration data.
Consistent daily solar energy, less reliable windpower
Solar production maximums in the chart are shifted from 11 AM - 1 PM to 1 - 3 PM due to chart times are Eastern zone, and largest solar supplies are in Texas (Central) and California (Pacific). The lowest production day was September 9.
Hourly electric generation from solar energy sources. U.S. Energy Information Administration chart created from Linecurrents.live custom query. Times are Eastern zone.
Windpower generation produced late-evening and early-overnight highs in each of the seven days. Lowest solar production day was September 9.
Hourly electric generation from wind energy sources. U.S. Energy Information Administration chart created from Linecurrents.live custom query. Times are Eastern zone.
Wind and solar electric energy daily production were complementary, as solar energy production increased mid-mornings when windpower declined.
Hourly electric generation from solar and wind energy sources. U.S. Energy Information Administration chart created from Linecurrents.live custom query. Times are Eastern zone.
Regional windpower:
highest production overnight
Texas, the Midwest, Central/Great Plains, California and northwest States are regions of greatest windpower. Maximum electric energy generation occurred overnight in these zones September 8-14, 2021.
Northwest
Windpower generation produced late-evening and early-overnight maximums all dates except September 8 in the region designated Northwest by the U.S. Energy Information Administration. The top windpower producing States in this region are Colorado, Washington, Oregon and Wyoming. September 9 was the lowest windpower production date.
California
Strongest windpower generation September 8-14, 2021 occurred late-evening and overnight in California. Lowest production occurred September 9.
Texas
Texas is the highest windpower producing U.S. State. The late-evening and early-overnight high production pattern was consistent September 8-14 , 2021. Lowest production occurred September 9.
Central
Windpower generation produced late-evening and early-overnight maximums in the Central region. Lowest production occurred September 8.
Midwest
Hourly wind electric generation September 8-14, 2021 did not reveal a daily pattern in the Midwest region. Lowest production occurred September 9.
The next section examines the hourly impact of removing all combustion electric supply from the U.S. contiguous 48 States’ three electric transmission grids, and increasing wind and solar electric generating capacity by a factor of seven. Results assume that new wind and solar electric plants are at existing sites, and perform the same as older units. Other new sites, such as off-shore windpower, may produce daily or seasonal production patterns which differ from existing sites.
September 8, 2021
U.S. non-combustion & total hourly electric supply
Total U.S. hourly generated electric energy supply is shown by the gray line in the following series of daily charts. Total includes includes wind, solar, hydroelectric and nuclear shown by color areas, as well as natural gas, coal, petroleum and other. Electric energy imported via electric transmission lines from Canada and Mexico are not included.
Linecurrents.live chart, U.S. Energy Information Administration data. Times are Eastern zone.
September 8, 2021
7X wind & solar
In the following examples, actual hourly U.S. contiguous 48-States solar and wind electric energy supplies are multiplied by 7.
These non-combustion energy sources, combined with existing nuclear and hydroelectric power generating capacity, would have been inadequate to replace combustion generation sources for most hours of September 8. Excess mid’-day solar energy oversupply, if stored in batteries or other systems, could be released during the evening shortage.
Linecurrents.live chart, U.S. Energy Information Administration data. Times are Eastern zone.
September 9, 2021
7X wind & solar
If U.S. 48 contiguous States’ wind and solar electric energy generation were each increased by 7 times, these sources combined with existing nuclear and hydroelectric power generating capacity would have been inadequate to replace combustion generation sources all hours September 9.
Linecurrents.live chart, U.S. Energy Information Administration data. Times are Eastern zone.
September 10, 2021
7X wind & solar
A U.S electric supply consisting of existing nuclear and hydroelectric, plus 7X wind/solar, would have been adequate to replace combustion electric generation for the entire day September 10, 2021. The energy oversupply of the first 18 hours, if stored, fills the evening electric generation shortage.
Linecurrents.live chart, U.S. Energy Information Administration data. Times are Eastern zone.
September 11, 2021
7X wind & solar
A U.S. electric generating fleet in which combustion energy sources are eliminated, and existing solar and wind plants increased by a factor of 7, would have produced more electric energy all hours of the day than was supplied by the existing generators all hours September 11, 2021.
Linecurrents.live chart, U.S. Energy Information Administration data. Times are Eastern zone.
September 12, 2021
7X wind & solar
The hypothetical 7X wind/solar plus existing nuclear and hydroelectric generating scenario is adequate to replace combustion electric generation in all but a few hours September 12, 2021. Energy oversupply of the first 19 hours, if stored, compensates for the evening electric generation shortage.
Linecurrents.live chart, U.S. Energy Information Administration data. Times are Eastern zone.
September 13, 2021
7X wind & solar
Another day of electric oversupply if combustion electric generating sources are replaced with 7-times the existing wind and solar U.S. generating capacity.
Linecurrents.live chart, U.S. Energy Information Administration data. Times are Eastern zone.
September 14, 2021
7X wind & solar
Windpower production was less in the evening hours September 14, compared to September 10 - 13. In a U.S. electric grid enhanced with 7X wind/solar, and combustion electric energy sources eliminated, storage systems could shift overnight wind and mid’-day solar oversupplies to fill some of the September 14 evening electric supply shortage.
Linecurrents.live chart, U.S. Energy Information Administration data. Times are Eastern zone.
Appendix
U.S. ENERGY INFORMATION ADMINISTRATION
HOURLY GRID MONITOR
Disclaimer: The information submitted by reporting entities is preliminary data and is made available "as-is" by EIA. Neither EIA nor reporting entities are responsible for reliance on the data for any specific use.
Factors which may affect future electric power transfers among U.S. regions
inadequacy of existing transmission grid to move large amounts of electric power between regions
new transmission line construction right-of-way acquisition and State/local jurisdiction issues
States, Balancing Authorities and regions priorities for use of potential excess variable wind/solar electric energy:
a) export to other BA’s or regions
b) store and consume with no export
c) consume electric energy when produced by electrification of transport, water and indoor space heating, and other fuel-switching away from fossil fuelshydroelectric supply reduction due to drought
nuclear electric supply reduction due to plant closures
other

A zero-combustion U.S. electric power scenario: September 1-7, 2021
Hourly & daily electric power supply if solar & wind electric generation is increased 7X
Hourly & daily U.S. electric power supply if solar & wind electric generation is increased 7X
Hourly solar and wind electric generation MegaWatthours across the 48 contiguous U.S. States, September 1-7, 2021. U.S. Energy Information Administration chart. Times are Eastern zone.
wind-powered electric energy was greater overnight
solar-electric energy ramped-up mornings as wind declined
24-hour daily charts show the effect of replacing all combustion electric generation with solar & wind
Overnight wind electric generation complemented mid’-day solar in the first seven days of September 2021, as shown in the chart above. Texas, the Midwest, Central/Great Plains, California and northwest States are regions of greatest windpower. Solar energy largest contributors are California and Texas.
This report examines the hourly impact of removing all combustion electric supply from the U.S. contiguous 48 States’ three electric transmission grids, and increasing wind and solar electric generating capacity by a factor of seven. Results assume that new wind and solar electric plants at existing sites, and perform the same as older units. Other new sites, such as off-shore windpower, may produce daily or seasonal production patterns which differ from existing sites.
Factors which may affect future bulk electric power transgrid transfers are not considered in this report. See Appendix for a list of these potential conditions.
U.S. States monthly electric generating totals by energy source may be compared at Linecurrents.live link to Energy Information Administration interactive maps and charts.
Notes
U.S. Energy Information Administration (EIA) Hourly Electric Grid Monitor is the source for data contained in the following charts. Please read EIA disclaimer in the Appendix.
Hourly charts in this report are based on Eastern time. Compared to local time at generator sites, hourly MWhr results are shifted to later in the day if the generator is not in the Eastern time zone:
1 hour: Central time zone - Midwest, Great Plains, Texas
2 hours: Mountain time zone
3 hours: Pacific time zone - Northwest, California
September 1-7, 2021
U.S. hourly electric power supply summary
Natural gas and coal combustion contributed the largest share of electric generation for the September 1-7, 2021 period.
Hourly electric generation from combustion and non-combustion energy sources. U.S. Energy Information Administration chart.
Electric generation from combustion and non-combustion energy sources. Linecurrents.live chart, U.S. Energy Information Administration data.
September 1, 2021
U.S. non-combustion & total hourly electric supply
Total U.S. hourly generated electric energy supply is shown by the gray line in the following series of daily charts. Total includes includes wind, solar, hydroelectric and nuclear shown by colored areas, as well as natural gas, coal, petroleum and other. MWhrs imported via electric transmission lines from Canada and Mexico are not included.
Linecurrents.live chart, U.S. Energy Information Administration data. Times are Eastern zone.
September 1, 2021
7X wind & solar
In the following examples, actual hourly U.S. contiguous 48-States solar and wind electric energy supplies are multiplied by 7.
These non-combustion energy sources, combined with existing nuclear and hydroelectric power generating capacity, would have been adequate to replace combustion generation sources for most hours of September 1. Overnight windpower and mid’-day solar energy oversupplies, if stored in batteries or other systems, could be released during the early-evening shortage.
Linecurrents.live chart, Energy Information Administration data. Times are Eastern zone.
September 2, 2021
7X wind & solar
If U.S. 48 contiguous States’ wind and solar electric energy generation were each increased by 7 times, these sources combined with existing nuclear and hydroelectric power generating capacity would have been adequate to replace combustion generation sources for most hours September 2. Oversupply stored in the afternoon could be released during the early-evening shortage.
Linecurrents.live chart, Energy Information Administration data. Times are Eastern zone.
September 3, 2021
7X wind & solar
Nuclear, hydroelectric, and 7X wind/solar electric energy would be inadequate to replace combustion electric generation after 4 PM Eastern September 3, 2021. Solar energy oversupply stored late-morning is insufficient to fill the evening electric generation shortage.
Linecurrents.live chart, Energy Information Administration data. Times are Eastern zone.
September 4, 2021
7X wind & solar
After strong performance September 1 and 2, windpower declined September 3 and 4. Wind and solar electric supply is unable to replace combustion generation all hours except late morning in the September 4 wind/solar 7X plus existing nuclear and hydroelectric generating scenario.
Linecurrents.live chart, Energy Information Administration data. Times are Eastern zone.
September 5, 2021
7X wind & solar
Windpower declined for third a straight day, and is unable to supply overnight electric demand. The 7X wind/solar plus existing nuclear and hydroelectric generating scenario is adequate to replace combustion electric generation for only a few late-morning hours.
Linecurrents.live chart, Energy Information Administration data. Times are Eastern zone.
September 6, 2021
7X wind & solar
Another low production day for windpower across the U.S. A recovery began late evening.
Linecurrents.live chart, Energy Information Administration data. Times are Eastern zone.
September 7, 2021
7X wind & solar
Windpower recovered to its September 1-2 strength in the 7X wind/solar plus existing nuclear and hydroelectric generating scenario. Energy storage systems could shift overnight wind and mid’-day solar oversupplies to fill the evening shortfall.
Linecurrents.live chart, Energy Information Administration data. Times are Eastern zone.
Regional hourly windpower:
Texas & California have the most consistent daily pattern
- - - - -
Note: actual hourly electric generation data are used in the next discussion. No multiplier has been applied.
- - - - -
A pattern of greatest wind electric energy generation overnight in Texas and California regions was evident September 1-7, 2021. Charts below illustrate hourly windpower for the highest-producing U.S. windpower regions. Vertical gray lines indicate hour starting 12:00 AM. Times are Eastern zone.
Northwest
Windpower generation did not produce a daily high-low cycle in the region designated Northwest by the U.S. Energy Information Administration. The top windpower producing States in this region are Colorado, Washington, Oregon and Wyoming.
California
Strongest windpower generation September 1-7, 2021 occurred late-evening and overnight in California. Lower production September 4-6 is similar to the national trend.
Texas
Texas is the highest windpower producing U.S. State. The late-evening and early A.M. highest-output daily pattern was consistent September 1-7, 2021.
Central
Hourly wind electric generation September 1-7, 2021 did not develop a daily pattern in the Central region.
Midwest
Hourly wind electric generation September 1-7, 2021 did not reveal a daily pattern in the Midwest region.
Appendix
U.S. ENERGY INFORMATION ADMINISTRATION
HOURLY GRID MONITOR
Disclaimer: The information submitted by reporting entities is preliminary data and is made available "as-is" by EIA. Neither EIA nor reporting entities are responsible for reliance on the data for any specific use.
Factors which may affect future electric power transfers among U.S. regions
inadequacy of existing transmission grid to move large amounts of electric power between regions
new transmission line construction right-of-way acquisition and State/local jurisdiction issues
States, Balancing Authorities and regions priorities for use of potential excess variable wind/solar electric energy:
a) export to other BA’s or regions
b) store and consume with no export
c) consume electric energy when produced by electrification of transport, water and indoor space heating, and other fuel-switching to away from fossil fuelshydroelectric supply reduction due to drought
nuclear electric supply reduction due to plant closures
other