Non-combustion electric supply more than 36% of total in fourth week of 2022
Electric Power Supply Review
U.S. contiguous 48 States
January 22-28, 2022
Photo by Marco Bicca on Unsplash near Duvall, Washington
February 17, 2021.
Quick summary
all non-combustion
wind, solar, nuclear and hydroelectric combined supplied 36.33% of total electric power generated.
solar electric
2.05% of total electric energy generated in the period.
windpower
8.72% of total electric energy generated in the period.
Note: data source for all charts is the U.S. Energy Information Administration (EIA) Hourly Electric Grid Monitor. See APPENDIX for explanation of data quality.
U.S. electric power supply: contiguous 48 States
January 22-28, 2022
Natural gas and coal combustion contributed the largest share of electric generation for the January 22-28, 2022 period. Nuclear power produced slightly less than one-fifth of the total. Windpower supplied more than four times the electric output of solar.
Total electric energy generated
84,420,525 MegaWatthours (MWH)
Non-combustion energy sources
36.33% of total
(wind, solar, nuclear and hydroelectric)
Total electric generation from combustion and non-combustion energy sources: January 22 -28, 2022. Linecurrents.live chart, U.S. Energy Information Administration (EIA) Hourly Electric Grid Monitor data.
Hourly electric generation to meet consumers consumption demand reveals the morning consumption peak was higher than the evening peak. Nuclear generation output remained nearly constant for the period. Grid operators adjusted coal and natural gas generation to follow peaks and valleys of consumers demand, and to adjust for variable wind turbine and solar array output.
Daily totals of non-combustion electric energy sources were varied only slightly during the period.
Solar electric
The largest U.S. solar electric sources are in Texas (Central time zone) and California (Pacific time zone).
Hourly data from each region outside of the Eastern Time Zone is adjusted to Eastern. The largest solar producing region is California, where 12:00 noon Pacific Time is 3:00 PM Eastern. Texas is the second-highest solar electric producer, where 12:00 noon Central Time is 1:00 PM Eastern. Charts are affected by use of Eastern time base, with solar energy shifted to the right.
U.S. contiguous 48 States hourly electric generation from solar energy January 22-28, 2022. Linecurrents.live chart, U.S. EIA Hourly Electric Grid Monitor data.
California region produced the most solar electric energy for the 7-day period
U.S. contiguous 48 States solar electric energy regional comparison January 22-28, 2022. Linecurrents.live chart, U.S. EIA Hourly Electrtic Grid Monitor data
Windpower
Maximum hourly windpower outputs occurred in late evenings and overnight, complementing daytime solar. January 24 showed the best all-day performance.
U.S. contiguous 48 States hourly electric generation from wind energy: January 22-28, 2022. Linecurrents.live chart, U.S. EIA Hourly Electric Grid Monitor data.
Midwest region produced the most windpower for the 7-day period.
U.S. contiguous 48 States windpower regional comparison January 22-28, 2022. Linecurrents.live chart, U.S. EIA Hourly Electric Grid Monitor data
Regional windpower
United States regions defined by U.S. Energy Information Administration (EIA). Southeast lacks significant windpower generation and is not included in this regional analysis. Map adapted from U.S. EIA Hourly Electric Grid Monitor . . . colors and region labels added by Linecurrents.live.
Hourly windpower for January 22-28, 2022 is shown in regional charts. Times are local. Northwest, Southwest and Mid-Atlantic regions span two time zones


January 22-28 regional
windpower highlights
Most consistent
Northwest except January 26
Most underperforming
California
Most reliable 24-hour pattern
None
Hourly electric supply:
non-combustion vs. total all sources
Morning and evening peaks, afternoon and overnight valleys. Electric power generation in the followed this regular pattern in the U.S 48 contiguous States . . . January 22-28, 2022. Local utility and regional power pool organizations adjust combustion and hydroelectric power output to match consumers’ demand, and to compensate for varying wind and solar electric sources.
Charts show hourly totals of the four non-combustion generating sources collected by U.S. EIA, and total of all electric energy sources including combustion and geothermal.
Solar electric supply ramps up after the morning consumption/generation peak demand, and is declining or offline during the evening peak.


The next section examines the hourly impact of removing all combustion electric supply from the U.S. contiguous 48 States’ three electric transmission grids, and increasing wind and solar electric generating capacity by a factor of seven. Results assume that new wind and solar electric plants are at existing sites, and perform the same as older units. Other new sites, including off-shore windpower, may produce daily or seasonal production patterns which differ from existing sites.
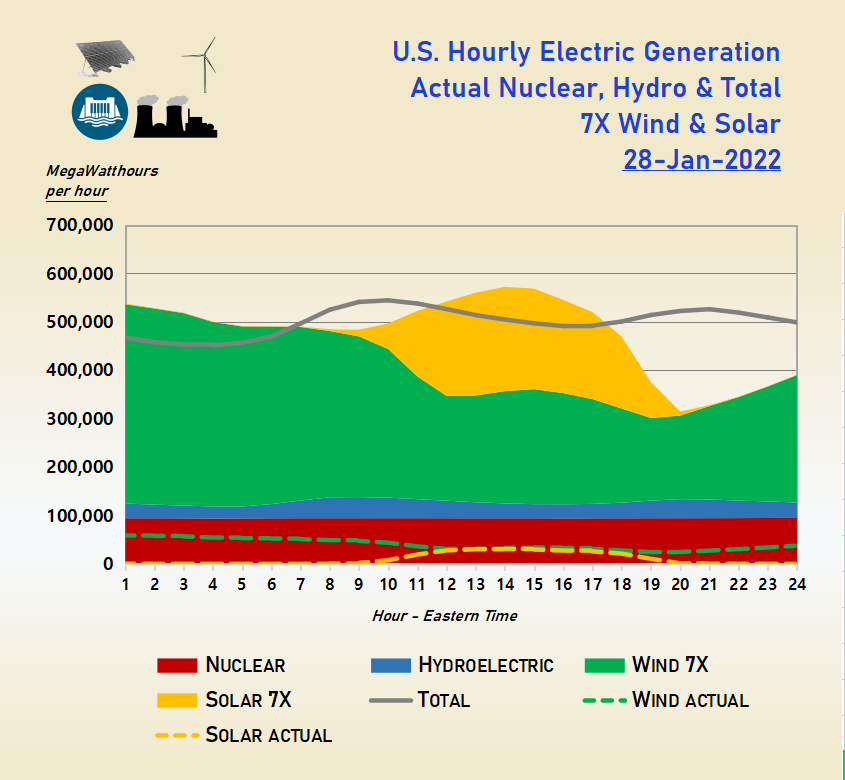
Daily electric supply if combustion sources are eliminated and wind/solar increased 7X
The following analysis illustrates scale-up of existing U.S. wind and solar electric generating capacity, and elimination of combustion generation sources. Nuclear and hydroelectric capacity now in service remain changed. Charts illustrate this scenario for each day January 22-28, 2022.
Total actual U.S. hourly generated electric energy supply is represented in the following charts by a gray line:
includes all electric generating sources: wind, solar, hydroelectric, nuclear, natural gas, coal, petroleum, geothermal..
is an estimate of U.S. electric consumers’ hourly consumption.
does not include electric energy imports or exports with Canada and Mexico via electric transmission lines.
Actual wind and solar hourly electric supply are shown as dashed green and yellow lines.
Arrows in the first 24-hour chart illustrate possible shifting of excess wind or solar stored in batteries or other systems to fill later shortages when consumer electric demand exceeds variable weather-dependent electric supply.


Appendix
data source
U.S. Energy Information Administration (EIA) Hourly Electric Grid Monitor is the source for data for this report. EIA provides this disclaimer:
Disclaimer: The information submitted by reporting entities is preliminary data and is made available "as-is" by EIA. Neither EIA nor reporting entities are responsible for reliance on the data for any specific use.
Factors which may affect future electric power transfers among U.S. regions
inadequacy of existing transmission grid to move large amounts of electric power between regions.
new transmission line construction delays due to right-of-way acquisition and State/local jurisdiction issues.
States, Balancing Authorities and Regions priorities for use of potential excess variable wind/solar electric energy, such as:
a) export electric energy to other Balancing Authorities or Regions.
b) store electric energy, instead of export, for later consumption.
c) consume electric energy immediately produced for electric transportation, water and indoor space heating, cold storage for air-conditioning, and other uses for which consumption may be controlled to synchronize with variable energy sources production.
d) hydroelectric supply replacement due to Western U.S. drought.
e) nuclear electric supply replacement due to plant closures.