windpower, tech-R&D Allyn Svoboda windpower, tech-R&D Allyn Svoboda

Floating Offshore Wind Turbines Explained

Overview of Floating Offshore Wind - National Renewable Energy Laboratory Webinar - March 17, 2020

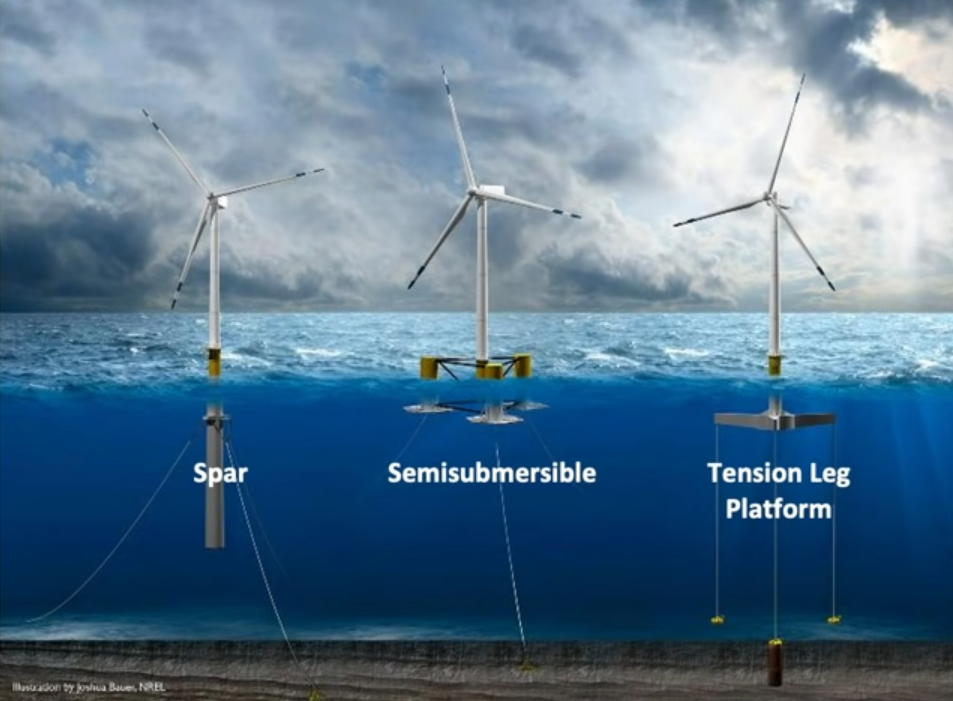
NREL webinar diagram - March 17, 2020


  • floating vs. fixed bottom foundations

  • best offshore locations - U.S. and global

  • floating turbine types

  • turbine spacing & air turbulence

  • electric cable network

  • offshore & land-based turbine sizes

  • turbine, foundation, and installation costs


Overview of Floating Offshore Wind
National Renewable Energy Laboratory Webinar
March 17, 2020

Walt Musial
Principal Engineer
Offshore Wind Research Platform Lead


National Renewable Energy Laboratory


Golden, Colorado USA


Webinar video available at NREL YouTube channel.


Floating wind turbine types
(from diagram above)

Spar: stability through ballast (weight) installed below its main buoyancy tank.
Challenges -- Deep draft limit port access.

Semisubmersible: achieves static stability by distributing bouyancy widely at the water plane.
Challenges -- Higher exposure to waves; more structure above the waterline.

Tension-leg platform (TLP)
Achieves static stability through mooring line tension with a submerged bouyancy tank.
Challenges -- Unstable during assembly; high vertical load moorings.


Best global sites for offshore wind energy production

NREL webinar map - March 17, 2020

Seafloor depth and proximity to population centers are factors in offshore windplant site selection.


Most existing global offshore wind turbine generators are installed on fixed bottom support structures

> NREL webinar diagram - March 17, 2020


U.S. coastal floor depths are shallower in Atlantic and Great Lakes regions

Lighter shades of blue indicate shallower floors. U.S. Department of The Interior - Bureau of Ocean Energy Management (BOEM) regulates 15 Lease Areas (red) giving developers exclusive site control of up to 25 gigaWatts (GW) capacity. BOEM has also identified 13 Call Areas (orange) - potential wind energy areas that under public review.


NREL webinar map - March 17, 2020 (Tap/click to enlarge).


U.S. offshore windspeeds are best near NE coast, northern California and Oregon

NREL webinar map - March 17, 2020

Darker colors indicate the best potential offshore wind energy sites, where average annual windspeeds are greater than 10 meters per second (22 miles per hour). Offshore wind electric energy may double the present U.S. annual electric energy consumption.


Floating foundations are required for depths greater than 60 meters

NREL webinar map - March 17, 2020

Dark-blue areas indicate potential offshore windpower areas where floor depths are greater than 60 meters. Great Lakes offshore wind plants may require adequate distance from shore to eliminate visual impact. Lake freezing is a design concern.


Floating wind turbine components

NREL webinar map - March 17, 2020


Offshore wind turbines sizes are larger

Growth of wind turbine sizes since 1980. Green grass at bottom left half of chart indicates land-based projects. NREL webinar diagram - March 17, 2020


Undersea electric cable grid design

NREL webinar diagram - March 17, 2020


Array voltage will soon increase to 66 kiloVolts (kV) to lower cost.

Electrical array cable cost increases with turbine spacing but decrease with turbine size.

Exact turbine spacing is a trade-off between wake losses and array cable cost.

Other factors such as navigation safety may play a role.


Offshore wind project electric collection network design is similar to an onshore electric utility distribution network, but performs the opposite function. Onshore powerlines and buried cables distribute electric power from a substation to end-users. Offshore submarine cables collect electric power from wind turbine generators for delivery to a floating substation, where the voltage is boosted and the electric power is delivered to shore via submarine transmission cables.


Higher windspeeds produce more electricity

Block Island Wind entered service as the first U. S. commercial offshore wind electric generating project in 2016. NREL offshore map above shows average annual windspeed at Block Island is 9.5 - 9.75 meters per second. At this windspeed, a 6 MW wind turbine at this site generates about 3.5 MW. Periods of windspeeds greater than the annual average generate the most electricity. At rated windspeed of about 12 meters per second, power output does not exceed the 6 MW rating, as rotor blades furl to prevent overspeed.

NREL webinar chart - March 17, 2020 (Tap-click to enlarge)


Total generating capacity at Block Island Wind is 30 MW (megaWatts) The project consists of 5 fixed-bottom turbines rated 6 MW each. Location is about 3.8 miles from Block Island off the Rhode Island Coast.


Challenge: turbine size and spacing affects airflow turbulence

Simulated wake turbulence downwind of turbines. NREL webinar diagram - March 17, 2020

Wake losses are the reduction of wind turbine generated electric power due to windspeed reduction and airflow turbulence caused by an upwind turbine


NREL webinar diagram - March 17, 2020

As wind turbine heights and rotor diameters increase, spacing must also increase to compensate for turbulence and wake losses.


Challenge: floating wind turbines rock and tilt

Modified from NREL webinar diagram - March 17, 2020

Wave motion affects floating offshore wind turbine power generation. Tilting toward the wind causes net windspeed to increase at rotor height, and to decrease when tilting motion is away from way from wind.


Cost of floating wind turbine plus on-site installation

Stehly, Tyler; and Philipp Beiter. 2020. 2018 Cost of Wind Energy Review. National Renewable Energy Laboratory, Golden, Colorado. NREL/TP-5000-74598. Funding provided by the U.S. Department of Energy Office of Energy Efficiency and Renewable Energy Wind Energy Technologies Office. NREL webinar chart - March 17, 2020

NREL’s 2018 Cost of Wind Energy Review estimated turbine electric generator will be 24.3 percent of the total installed cost of floating offshore wind plants. Section 5.2 of this report explains factors which produced this estimate, including global floating offshore wind plant construction - excerpt below:

2018 Cost of Wind Energy Review (NREL)
(excerpt)

Given the relatively limited number of offshore wind projects in the United States and the lack of publicly available data, we obtained the CapEx estimates using ORCA (Beiter et al. 2016). The representative turbine characteristics (i.e., turbine capacity, rotor diameter, and hub height) used as inputs to the model were obtained from the “2018 Offshore Wind Technologies Market Report” (Musial et al. 2019). The capacity-weighted average turbine installed globally in 2018 was 5.5 MW with a 140-m rotor diameter at a 94-m hub height. We used these turbine parameters in combination with the spatial parameters presented in Table 12 for the fixed-bottom and floating reference sites to calculate CapEx.

The ORCA model yields a total installed CapEx value of $4,444/kW for the fixed-bottom reference site and $5,355/kW for the floating reference site. It should be noted that the CapEx estimates for floating offshore wind in this analysis assume a 5.5-MW turbine and are not necessarily optimized for floating offshore wind applications, therefore, they may negatively impact CapEx estimates. Progression to larger turbines is likely to coincide with deployment of commercial-scale floating wind technologies (Spyroudi 2016).

Read More
solar energy, tech-R&D Allyn Svoboda solar energy, tech-R&D Allyn Svoboda

$125.5 Million Solar Technologies R&D Funding Opportunity Announced by US-DOE

DOE describes the categories of Photovoltaic (PV) and Concentrating Solar Power (CSP) research & development proposals which will qualify for grant funds. Linecurrents reviews two CSP generating stations which were US Department of Energy loan guarantee recipients in the last decade.
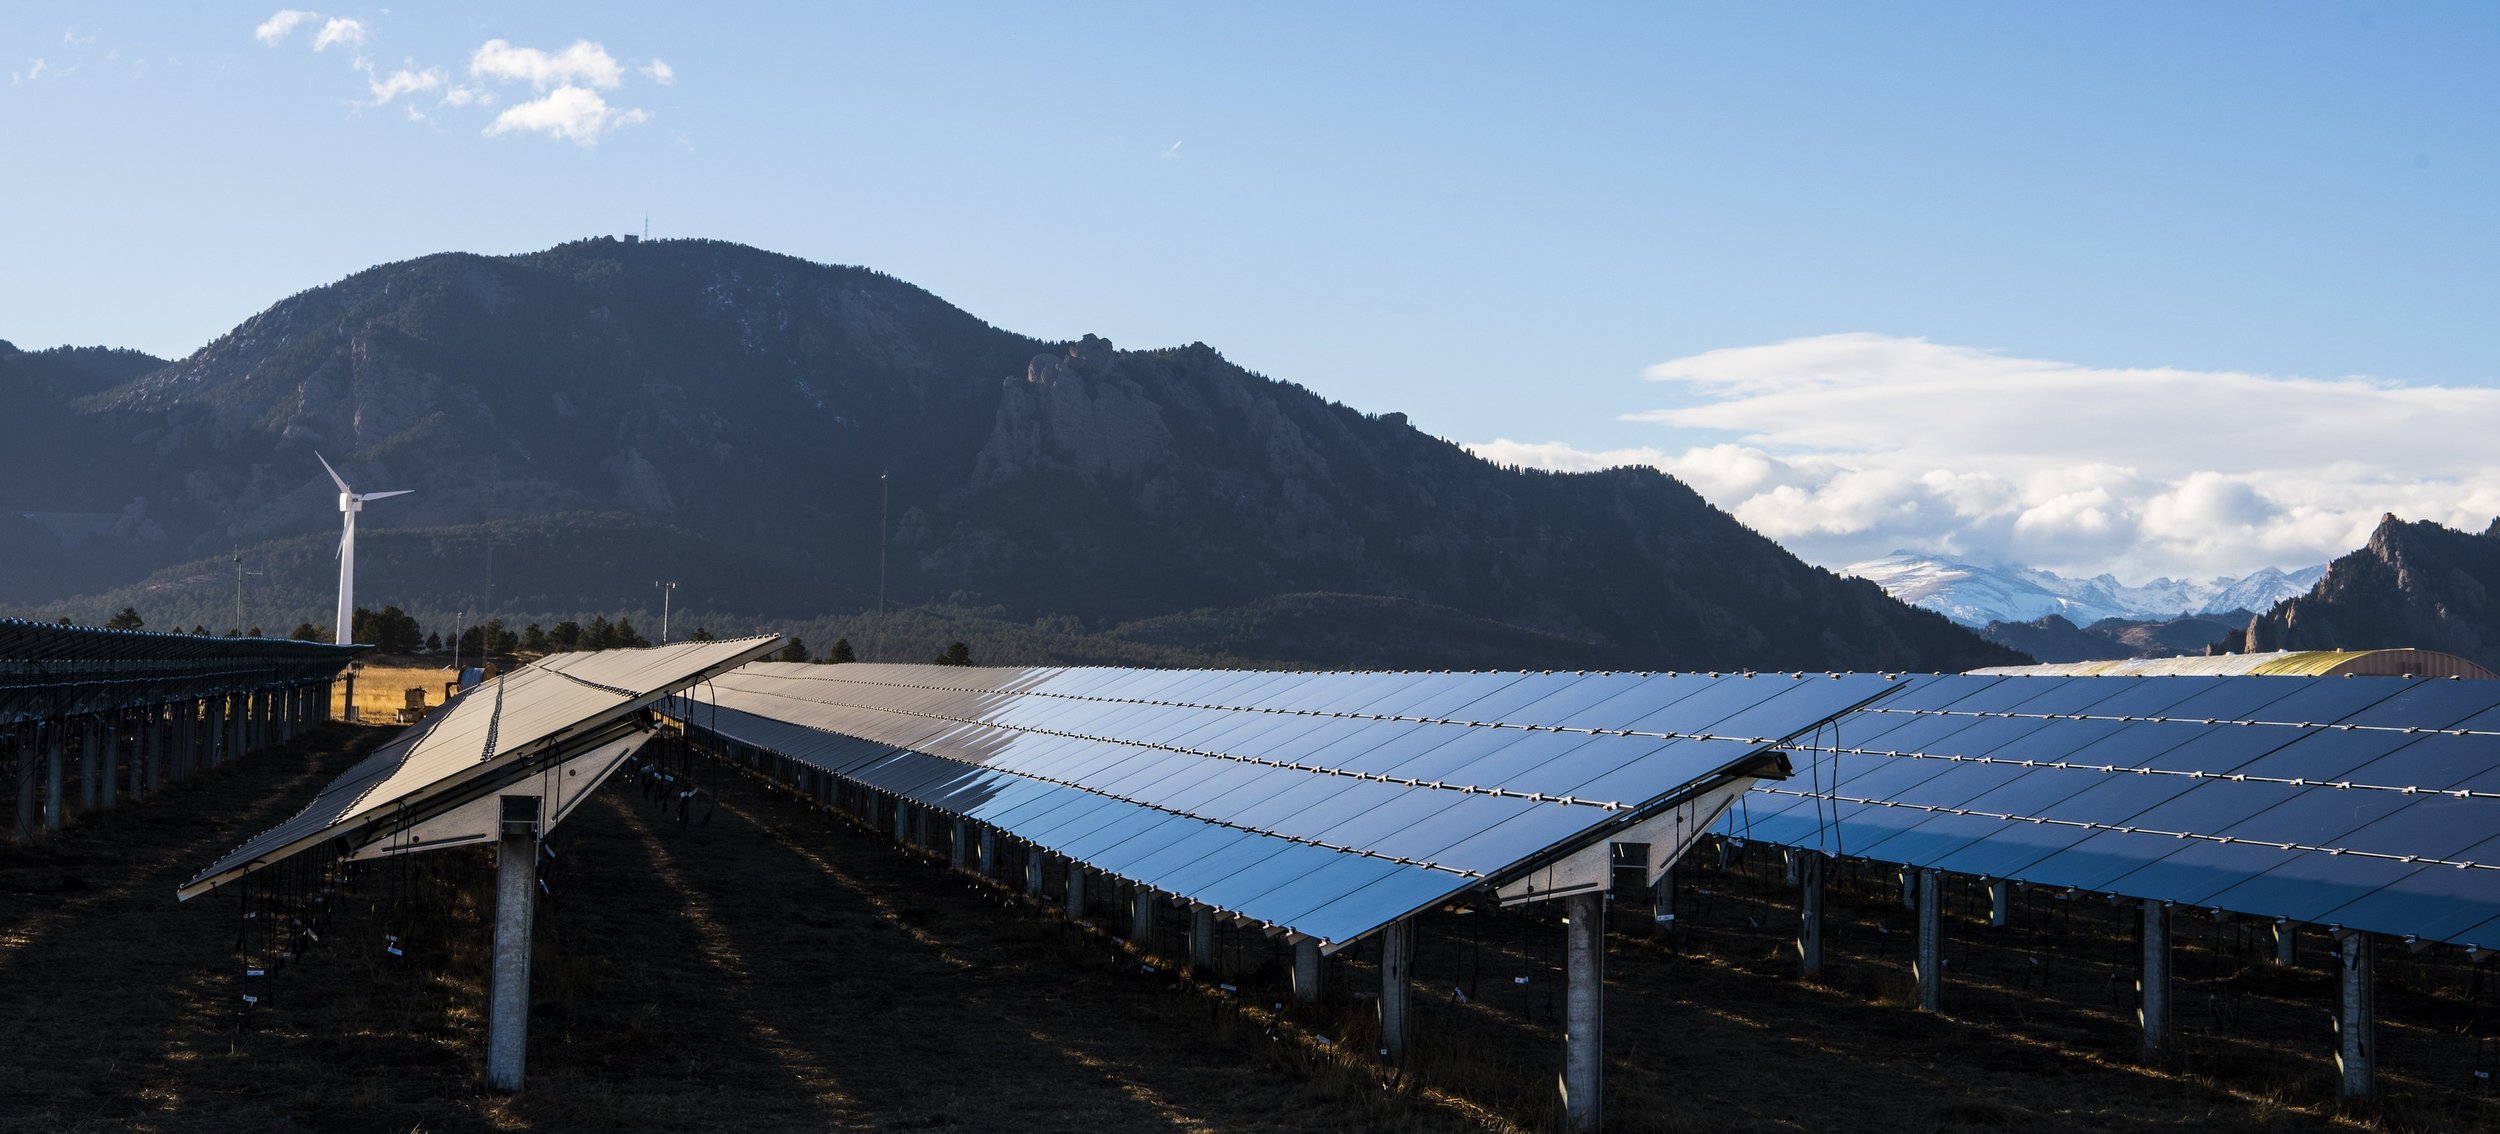
North section of a 200 kiloWatt (KW) community solar site near Norwood, Colorado. The February 5, 2020 US DOE solar energy research & development funding opportunity includes PV and CSP projects which advance innovative and novel ideas. Linecurr…

North section of a 200 kiloWatt (KW) community solar site near Norwood, Colorado. The February 5, 2020 US DOE solar energy research & development funding opportunity includes PV and CSP projects which advance innovative and novel ideas. Linecurrents photo.


Funding opportunities for:

  • photovoltaic and concentrating solar power (CSP) hardware

  • manufacturing

  • microgrid integration

  • agricultural co-location

  • artificial intelligence

  • innovative small projects

- - - -

History of 2 US DOE-supported CSP generating stations reviewed: Crecent Dunes & Ivanpah.


Below are excerpts of a February 5, 2020 announcement by the Solar Energy Technologies Office (SETO) of the United States Department of Energy (DOE) -- Office of Energy Efficiency and Renewable Energy (EERE).


February 5, 2020
Washington, DC

Funding will support advancements in the following areas:

  • Photovoltaics (PV) Hardware Research
    $15 million for 8-12 projects that aim to extend PV system lifetimes and reduce hardware costs of solar systems made of silicon solar cells, as well as new technologies like thin-film, tandem, and perovskite solar cells.

  • Integrated Thermal Energy Storage and Brayton Cycle Equipment Demonstration (Integrated TESTBED
    $39 million for 1-2 projects that will develop a test site to accelerate the commercialization of supercritical carbon dioxide power cycles, a key component of low-cost concentrating solar power plants.


Falling Particle Tower - Example of Supercritical Carbon Dioxide (sCO2) Concentrating Solar Power system. Image: Mehos, Turchi, Vidal, et al, Concentrating Solar Power Gen3 Demonstration Roadmap, NREL/TP-5500-67464, January 2017. Energy.gov.

Falling Particle Tower - Example of Supercritical Carbon Dioxide (sCO2) Concentrating Solar Power system. Image: Mehos, Turchi, Vidal, et al, Concentrating Solar Power Gen3 Demonstration Roadmap, NREL/TP-5500-67464, January 2017. Energy.gov.


  • Solar Energy Evolution and Diffusion Studies 3 (SEEDS 3)
    $10 million for 6-8 projects that will examine how information flows to stakeholders to enable more efficient decision-making about solar and other emerging technologies, such as energy storage.

  • Innovations in Manufacturing: Hardware Incubator
    $14 million for 7-9 projects that will advance innovative product ideas from a prototype to a pre-commercial stage, with an aim for products that support a strong U.S. solar manufacturing sector and supply chain.

  • Systems Integration
    $30 million for 7-11 projects that will develop resilient community microgrids to maintain power during and restore power after man-made or natural disasters, improve cybersecurity for PV inverters and power systems, and develop advanced hybrid plants that operate collaboratively with other resources for improved reliability and resilience.

  • Solar and Agriculture: System Design, Value Frameworks, and Impacts Analysis
    $6.5 million for 4-6 projects that will advance the technologies, research, and practices necessary for farmers, ranchers, and other agricultural enterprises to co-locate solar and agriculture.

  • Artificial Intelligence Applications in Solar Energy with Emphasis on Machine Learning
    $6 million for 8-12 projects that encourage partnerships between experts in AI and solar industry stakeholders to develop disruptive solutions across the value chain of the solar industry.

  • Small Innovative Projects in Solar (SIPS): PV and Concentrated Solar Power (CSP)

    $5 million for 15-20 projects that advance innovative and novel ideas in PV and CSP that can produce significant results within the first year of performance.


Supercritical CO2 CSP:
more efficient for converting sunlight into electric energy


Excerpts from US Department of Energy - energy.gov. Full list of references at end of this report.

- - - - -

Supercritical carbon dioxide (sCO2) power cycles have the potential to reduce the cost of concentrating solar power (CSP) by far more efficiently converting high-temperature solar heat into electricity. 

When carbon dioxide (CO2) is held above its critical temperature and pressure, it acts like a gas yet has the density of a liquid. In this supercritical state, small changes in temperature or pressure cause dramatic shifts in density - making sCO2 a highly efficient working fluid to generate power.

The Solar Energy Technologies Office pursues dramatic cost reductions in technologies to make solar electricity available to all Americans. Next-generation CSP system designs use sCO2 turbine power cycles to more efficiently convert solar thermal energy to electricity and reduce the cost of CSP technology.

Three DOE Offices (Nuclear Energy, Fossil Energy, and Energy Efficiency and Renewable Energy - SETO) are working together to reduce the technical hurdles and support foundational research and development of sCO2 power cycles.

Because sCO2 power cycles work best at very high temperatures and under intense pressure, a CSP system needs receivers and heat exchangers that can withstand these conditions. Heat exchangers contribute up to 60%−70% of the total cost of a CSP sCO2 turbine system, so low-cost, highly efficient exchangers are necessary to help make CSP cost-competitive.

Benefits of CO2 CSP

  • Potential to increase maximum temperature of the heat transfer media to <1,000 deg C .

  • Well-suited for scalability to 10-100 MWe power tower systems.

  • Reduces water consumption compared to current Rankine process.

  • Makes smaller, more dispatchable power plants cost viable.

  • Reduces capital costs by increasing the efficiency of converting sunlight into energy.


Nevada CSP powerplant supported by US DOE loan guarantee risks bankrupcty

Crescent Dunes Concentrating Solar Energy Project near Tonapah, Nevada. Electrical generating capacity is 110 megaWatts (MW). U.S. Department of Energy photo.

Crescent Dunes Concentrating Solar Energy Project near Tonapah, Nevada. Electrical generating capacity is 110 megaWatts (MW). U.S. Department of Energy photo.


Excerpts from US Department of Energy - energy.gov. Full list of references at end of this report.

- - - - -

In power tower concentrating solar power systems, a large number of flat, sun-tracking mirrors, known as heliostats, focus sunlight onto a receiver at the top of a tall tower. A heat-transfer fluid heated in the receiver is used to heat a working fluid, which, in turn, is used in a conventional turbine generator to produce electricity. Some power towers use water/steam as the heat-transfer fluid. Other advanced designs are experimenting with high temperature molten salts or sand-like particles to maximize the power cycle temperature.

. . . Crescent Dunes features a solar receiver that sits atop a tower and absorbs sunlight from over 10,000 mirrors. These mirrors follow the sun over the course of a day and magnify the sun’s power 1,200 times, heating molten salt to high temperatures. This molten salt circulates through the tower and is then used to heat a steam cycle that generates electricity. The plant also features an automated system that controls the flow of molten salt to the receiver.

. . . the molten salt heats more than 60 million pounds of salt each day to reach a consistent 1,050 degrees Fahrenheit. The salt continually circulates in a loop, enabling its reuse by storing it in tanks for use at a later time.

. . . the plant’s energy storage integration delivers solar energy captured during the day to the grid during the late afternoon and evening when the demand for power is at its highest.

. . . Since the molten salt absorbs 90% of the solar energy it receives and is used as both a heat transfer fluid and a storage medium, the plant is highly efficient. Crescent Dunes also eliminates reliance on fossil fuels as a backup energy source, enabling solar to operate as baseload generation and reliably deliver peak-period electricity to more than 75,000 homes in Nevada.

. . . Crescent Dunes is the first deployment of solar power tower technology in the United States that uses molten salt as a primary heat transfer fluid. The heat absorbed by the salt can be stored and produce electricity when required. This enables the plant to generate clean, renewable power during times when direct sunlight is not available. The innovative molten salt storage allows the project to generate power at full load on call (dispatched) for up to 10 hours without any sunlight.

In November 2015, Crescent Dunes successfully reached commercial operation and every year delivers 110 MW of electricity, plus 1.1 gigawatt-hours of storage under a 25-year power purchase agreement with NV Energy, the largest utility in Nevada.

- End of excerpts -

- - - - -

Owner sues US DOE and plant operator, utility cancels contract

The US Department of Energy finalized a $737 million loan guarantee to Tonopah Solar Energy, LLC to develop the Crescent Dunes Solar Energy Project in September 2011. The site is 14 miles northwest of Tonopah, Nevada on land leased from the Bureau of Land Management - U.S. Interior Department.

Contractual and legal problems developed for Crescent Dunes in October 2019. The Las Vegas Review-Journal reported that Crescent Dunes owner SolarReserve sued the U.S. Department of Energy and plant operator Tonopah Solar Energy.  SolarReserve claims in its lawsuit that US-DOE’s takeover of Tonopah's Board of Managers leaves SolarReserve without board representation, and no voice in decisions such as bankruptcy proceedings, according to reports from multiple energy news sources, including Newsdata.com.

Electric utility NV Energy terminated its 25-year contract to purchase electricity generated at Crescent Dunes October 4, 2010 - (Newsdata.com). The NV Energy - Crescent Dunes Power Purchase Agreement would was to have expired in 2040 - (Mineral County Independent-News). Electricity generated at Crescent Dunes cost NV Energy about $135 per ­megaWatthour - , (13.5 cents per kiloWatthour) compared with less than $30 per MWh today at a new Nevada photovoltaic solar farm, according to January 6, 2020 report by - (Bloomberg Green). Crescent Dunes had been shutdown since April 2019.


Mojave Desert CSP generating since 2013

Ivanpah Solar Electric Generating Station - Mojave Desert, California. Electrical generating capacity is up to 400 megawatts (February 2017 data). US Department of Energy image.

Ivanpah Solar Electric Generating Station - Mojave Desert, California. Electrical generating capacity is up to 400 megawatts (February 2017 data). US Department of Energy image.


Ivanpah CSP quick facts

Federal loan guarantees
US Department of Energy issued three loan guarantees for $1.6 billion in total to finance Ivanpah, April 2011.

Generating Capacity

Unit MW
Ivanpah 1 126
Ivanpah 2 133
Ivanpah 3 133
Total 392

Electric utility power purchasers
Pacific Gas & Electric (PG&E) and Southern California Edison.

Energy storage capacity
None.

Land area
3,500 acres on federal land managed by the Bureau of Land Management.

Towers height
459 ft

Number of Heliostats
173,500

Heliostat description
Each heliostat consists of two mirrors.

Receiver type
Solar receiver steam generator.

Receiver inlet temperature
480 F

Receiver outlet temperature
1050 F

Wildlife habitat support (videos)
Bird acoustical deterrent.
Desert tortoise population analysis, juvenile relocation.
- see Stewardship of Natural Resources at Ivanpah videos


Read More
windpower, tech-R&D Allyn Svoboda windpower, tech-R&D Allyn Svoboda

Lightning Science and Wind-Turbine Electric Generator Protection

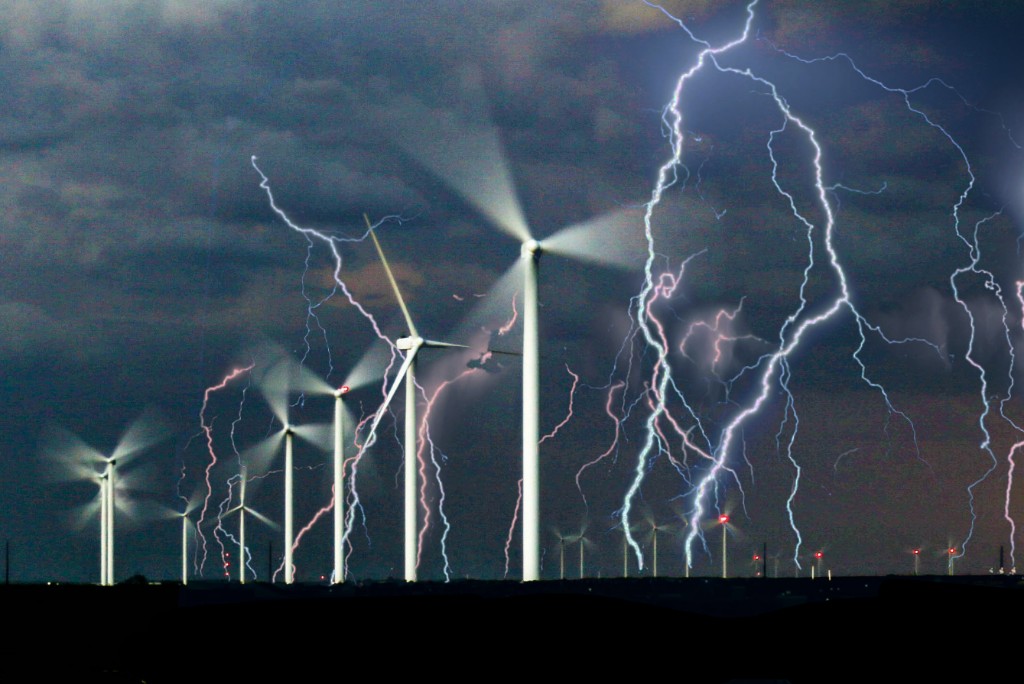
A celltower in Switzerland is struck by lighting more than 100 times per year. Scientists collect data there which may lead to lightning-resistant wind-turbine electric generator designs.
Linecurrents composite image created from wind-turbine generators photo by Cassie Boca and lightning photo by Clinton Naik at Unsplash.com.


  • Lightning strikes may damage wind-turbine generators.

  • “Upward” lightning from structure to cloud is a recent phenomenon.

  • Researchers describe 21st-century “Ben Franklin” lightning-strike observations — Science Friday podcast August 16, 2019 episode.


Where There’s Thunder, There’s Lightning Science is the title of a recent Science Friday public radio program segment. Research into lightning strike characteristics such as described in the program may aid in wind turbine electric generating equipment design to reduce or prevent damage caused by lightning’s high-energy electrical discharge.

SciFri host Ira Flatow and Institute of Electrical and Electronic Engineers (IEEE) Spectrum news editor Amy Nordrum interviewed lightning science researcher Farhad Rachidi of the Swiss Federal Institute of Technology (EPFL), electrical engineering professor Bill Rison of New Mexico Tech at Socorro, and research scientist Ryan Said of Vaisala during the August 16, 2019 broadcast of Science Friday.

The 34-minute segment and is available for replay at the Science Friday website (link below), and for download at online podcast services.

EPFL scientists collect lightning-strike data from instruments installed at Säntis Tower in Switzerland, at elevation 2,502 m (8,209 ft) on Säntis mountain. Lightning strikes the tower more than 100 times per year.

New Mexico Tech’s Rison and Mark Stanley installed a custom-designed broadband interferometer, built by Stanley, on Säntis Tower to provide measurements for EPFL analysis.


The Säntis team’s work has held particular relevance for wind farm operators. That’s because most strikes recorded at the tower are examples of upward lightning—which travels from ground-to-cloud instead of cloud-to-ground. - IEEE Spectrum


Some of the Science Friday segment discussion concentrates on characteristics and physics of lightning, and research designed to gain greater understanding of lightning dynamics. Rachidi’s comments about WTGs and “upward — downward” lightning strikes begins at about 17 minutes into the audio track.

Vaisala provides weather, environment, and industrial measurements services, including the U.S. National Lightning Detection Network.


Read More
nuclear, tech-R&D Allyn Svoboda nuclear, tech-R&D Allyn Svoboda

Nuclear Regulatory Commission Issues Tennessee Valley Authority Initial Approval for Small Modular Reactor Powerplant Site

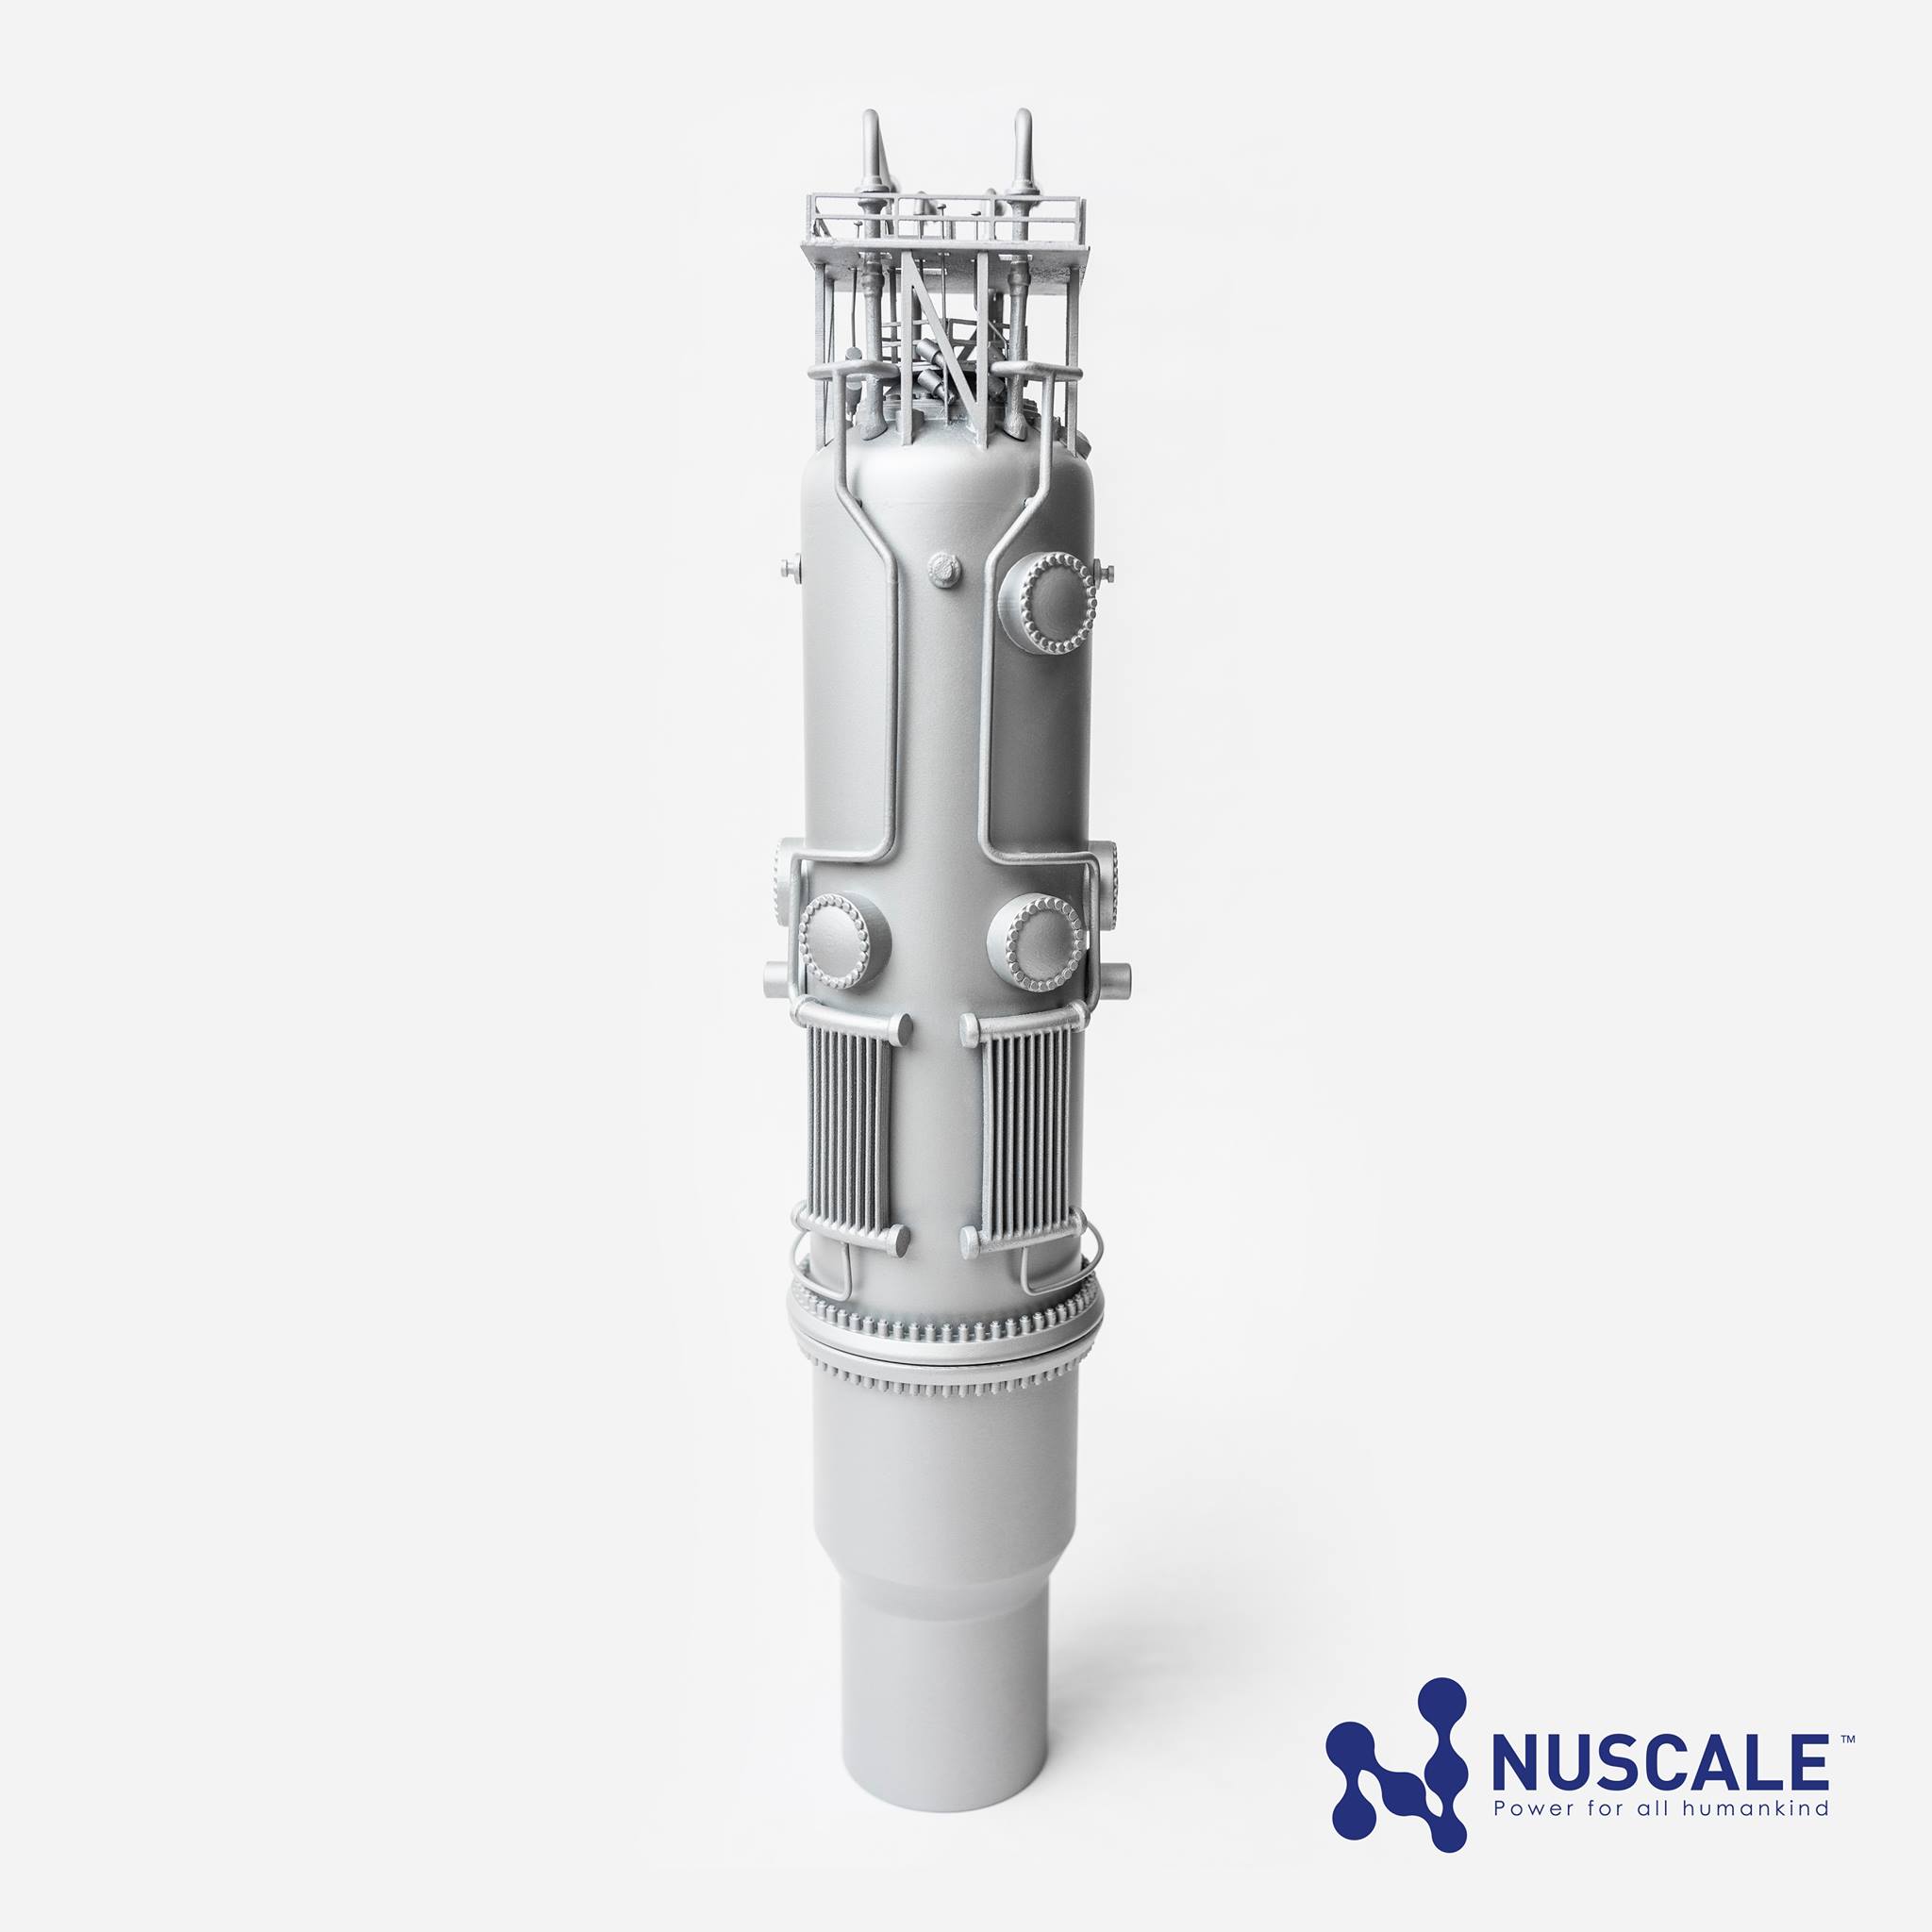
Pre-assembled small modular nuclear reactor for electricity generation advances in site and design regulatory approval process..

Small modular reactor (SMR) power module. NuScale Power image.


  • Proposed site is the the former Clinch River Breeder Reactor project, cancelled in 1983, near Oak Ridge, Tennessee.

  • Tennessee Valley Authority (TVA) site application is based on small modular reactor (SMR) design.

  • Nuclear Regulatory Commission (NRC) will conduct a mandatory hearing on the TVA Clinch River site permit later this year.

  • NRC is reviewing NuScale Power’s SMR design for future commercial U.S. electric power generation.


Links to more information are listed in the Sources section at end of this report.

See Appendix for NRC news release and correspondence excerpts.


The United States Nuclear Regulatory Commission (NRC) has completed two steps in its review of Tennessee Valley Authority’s application to build a small modular reactor (SMR) nuclear-powered electric generating station:

  1. NRC published an Environmental Impact Statement - Final Report for the Tennessee Valley Authority’s (TVA) proposed Clinch River site April 3, 2019.

  2. NRC announced completion of NRC staff’s Final Safety Evaluation Report for TVA’s Early Site Permit application June 18, 2019. NRC will conduct a mandatory hearing to review the report later this year.

A TVA spokesman told the Chattanooga Times Free Press that the NRC Clinch River SMR site permit provides another option for future energy supplies, but that “TVA is years from a decision whether or not to build an SMR.”

TVA is the largest United States government-owned power provider, delivering electricity to local power companies and to large, energy-intensive industrial customers and federal facilities. TVA’s electricity generation portfolio is 37% nuclear, 24% coal, 20% natural gas, 9% hydro, 3% wind + solar and 7% energy efficiency, consisting of:

  • 7 fossil plants (29 active units)

  • 3 nuclear plants (7 units)

  • 29 hydro plants (109 units)

  • 1 pumped storage hydroelectric plant (4 units)

  • 9 natural gas combustion turbine gas plants (85 units)

  • 7 natural gas combined cycle gas plants (15 units)

  • 1 diesel generator site (5 units)

  • 15 solar energy sites

  • 1 wind energy site

TVA will close two coal-fired powerplants in the next few years: Paradise in western Kentucky (2020), Bull Run near Oak Ridge, Tennessee (2023).

TVA sold more than 152.3 billion kilowatt-hours of electricity for revenue of about $10.7 billion in fiscal year 2017.

Sources: TVA, NRC, Chattanooga Times Free Press


Tennessee Valley Authority service area. Linecurrents map adapted from TVA similar.


NRC Approval of NuScale Power SMR Design Expected in 2020

NRC accepted an SMR design certification application (DCA) from NuScale Power in March 2017 for further review. Responding to a Linecurrents inquiry regarding status of its Nuclear Regulatory Commission application, NuScale Power replied June 21, 2019

“NuScale’s SMR is on schedule to earn NRC approval by September 2020. The NRC’s review of the company’s design certification application (DCA) began in March 2017. The NRC completed the first and most intensive phase of review of NuScales’s DCA; a major achievement. Phase 2, 3, and 4 of Design Certification Review are now in progress.”

NRC completed Phase 1 review of NuScale’s SMR design in April 2018.

NuScale describes SMR powerplant generating capacity and economies nuscale.com:

A NuScale power plant can house up to 12 SMRs for a total facility output of up to 720 megawatts (gross). The SMR design is scalable, allowing customers to incrementally increase facility output to match demand. It is also flexible, providing significant opportunities to reduce the financial commitments and overall production costs normally associated with giga-watt size nuclear facilities, including the amount of required staff because of the SMR’s unparalleled safety features.”

Sources: NuScale Power > About Us


NuScale describes its SMR safety features:
Below list quoted from NuScale.com.

  • . . safely shuts down and self-cools, indefinitely with no operator action, no AC or DC power.

  • High-pressure containment vessel, redundant passive decay heat removal, and containment heat removal systems.

  • . . . integrated design of the NuScale Power Module, encompassing the reactor, steam generators, and pressurizer, and its use of natural circulation eliminates the need for large primary piping and reactor coolant pumps.

  • A small nuclear fuel inventory, since each 60 MWe (gross) NuScale Power Module houses approximately 5 percent of the nuclear fuel of a conventional 1,000 MWe nuclear reactor.

  • Containment vessel submerged in an ultimate heat sink for core cooling in a below grade reactor pool structure housed in a Seismic Category 1 reactor building.

Sources: NuScale Power > Safety


NuScale SMR Design and Development History

SMR design began in 2000 with U.S. Department of Energy (DOE) funding. Idaho National Environment & Engineering Laboratory led the project with support from Oregon State University (OSU), which gained experience with development of passive safety systems that use natural circulation to provide cooling for nuclear powerplants.

The DOE research project concluded in 2003. OSU designers built a one-third scale electrically-heated version of their plant as a test facility. OSU granted NuScale Power exclusive rights to the nuclear powerplant design in 2007. (Sources: NuScale Power > History).

Sources: NuScale Power > History

NuScale’s most recent DOE funding consisted of $40 million in cost-sharing financial assistance from DOE’s Office of Nuclear Energy “U.S. Industry Opportunities for Advanced Nuclear Technology Development” funding opportunity in 2018.

Sources: NuScale Power > DOE


NuScale office and design/engineering locations:

Portland, Oregon - headquarters
Corvallis, Oregon
Charlotte, North Carolina
Rockville, Maryland
Arlington, Virginia
Richland, Washington
London, United Kingdom


Sources


Appendix

NRC Completes Safety Review of Early Site Permit for Clinch River Nuclear Site


Excerpts from Nuclear Regulatory Commission
News Release


NRC News
Office of Public Affairs
Washington, DC
June 18, 2019
_ _ _ _ _ _ _

The Nuclear Regulatory Commission staff has completed its Final Safety Evaluation Report for an Early Site Permit application from Tennessee Valley Authority for the Clinch River Nuclear Site. The report concludes there are no safety aspects that would preclude issuing the permit for the site, approximately five miles southwest of Oak Ridge, Tenn.

The approximately 600-page report describes the agency's review of the application, and incorporates comments from the Advisory Committee on Reactor Safeguards. The NRC staff reviewed information on topics including:

• site seismology, geology, meteorology and hydrology;

• risks from potential accidents resulting from operation of a nuclear plant at the site; and

• the major features of the emergency plan TVA would implement if a reactor was built at the site.

The report also reviewed unique aspects of the application. These included requests for exemptions from some offsite emergency planning requirements, including the plume exposure pathway emergency planning zone, as well as a proposed plume exposure planning zone size methodology. A future reactor license applicant could use the sizing methodology to determine an appropriate planning zone for the application’s specific reactor type.

The ESP process allows an applicant to address site-related issues, such as environmental impacts, for possible future construction and operation of a nuclear power plant at the site. TVA submitted the application on May 12, 2016. More information on the ESP process is available on the NRC website.

The staff will provide the report on the application to the Commission for a mandatory hearing on the permit later this year. The staff issued its Environmental Impact Statement on the application in April 2019. The Commission will conduct the hearing to determine whether the staff’s review supports the findings necessary to issue the permit.


End of excerpts from Nuclear Regulatory Commission
News Release


Possible configuration of a small modular reactor powerplant site. NuScale Power image.


NRC Advisory Committee: SMR Is Safe to Operate at Clinch River Proposed Site


Excerpts from Nuclear Regulatory Commission
Advisory Committee Correspondence


United States Nuclear Regulatory Commission
Advisory Committee on Reactor Safeguards
Washington, DC 20555 - 0001

January 9, 2019

The Honorable Kristine L. Svinicki
Chairman
U.S. Nuclear Regulatory Commission
Washington, DC 20555-0001

SUBJECT: EARLY SITE PERMIT – CLINCH RIVER NUCLEAR SITE

Dear Chairman Svinicki:

During the 659th meeting of the Advisory Committee on Reactor Safeguards (ACRS), December 6-7, 2018, we completed our review of the early site permit application submitted by the Tennessee Valley Authority (TVA) for two or more small modular reactors (SMRs) at its Clinch River Nuclear (CRN) Site, and the NRC staff’s safety evaluation report. Our Regulatory Policies and Practices Subcommittee received an informational briefing on this topic on November 15, 2017, and also reviewed this matter at its meetings on May 15, August 22, October 17, and November 14, 2018. During our reviews, we had the benefit of discussions with the staff and representatives of TVA. We also had the benefit of the referenced documents. Our reviews of the application and the safety evaluation report were conducted to fulfill the requirements of 10 CFR 52.23, which states that the ACRS shall report on those portions of an early site permit application that concern safety.

CONCLUSION AND RECOMMENDATIONS

  1. Small modular reactors with design characteristics within the plant parameter envelope used by TVA in developing its Clinch River Nuclear Site early site permit application can be constructed and operated without undue risk to the health and safety of the public.

  2. The staff’s safety evaluation report of the TVA early site permit application should be issued. The staff accepted TVA’s plume exposure pathway emergency planning zone sizing methodology; two major features emergency plans (one plan for a site boundary plume exposure pathway emergency planning zone and a second plan for an approximate 2-mile radius plume exposure pathway emergency planning zone); and associated exemption requests. The safety evaluation report also identified a number of items that are treated either as permit conditions or as action items that must be addressed at the operating license stage.

  3. The early site permit for the Clinch River Nuclear Site should be issued.

BACKGROUND

An early site permit is the Commission’s approval of the safety and environmental suitability for a proposed site to support future construction and operation of one or more nuclear power plants. TVA’s submittal addresses site suitability issues, environmental protection issues, and plans for coping with emergencies, independent of the review of a specific nuclear power plant design. Before a plant can be constructed, either under a combined license or a construction permit, a specific reactor technology for the site must be reviewed and approved by the NRC.

TVA filed an early site permit application for its CRN Site in May 2016 and the NRC accepted and docketed the application in December 2016. The TVA application was based on a plant parameter envelope (PPE) approach as a surrogate for a specific plant design. Using inputs from four prospective vendors (NuScale, Holtec, BWX Technologies, and Westinghouse) of light-water reactor-derivative SMR designs, TVA determined bounding values for construction and operation of two or more SMRs at the CRN Site with a total nuclear generating capacity up to 2420 MWt and 800 MWe (up to 800 MWt for a single unit or module). This approach allows TVA flexibility, while also potentially reducing licensing risk. . . .

SUMMARY

The TVA early site permit application and the staff’s review demonstrated suitability of the CRN Site considering topics including surrounding population, external hazards, site physical characteristics, potential radionuclide releases, and emergency preparedness. This application is unique in its approach to emergency planning in that it proposes a risk-informed, dose-based, consequence-oriented methodology to determine the appropriate PEP EPZ. We note that this is in parallel to proposed rulemaking on emergency preparedness for small modular reactors and other new technologies, which we agreed with in our recent October 19, 2018 letter on this subject.

The TVA early site permit application benefits from the proposed use of advanced light-water reactor-derivative SMR designs that are expected to exhibit both lower accident frequencies and consequences than the current fleet of large light-water reactors; the large body of knowledge associated with light-water reactor technology, particularly regarding source terms; and extensive light-water reactor operating and licensing experience. TVA’s approach to emergency planning in providing dose savings is consistent with that used in developing NUREG-0396 and the staff’s proposed current rulemaking on the matter. The early site permit for the Clinch River Nuclear Site should be issued.

Sincerely,
Michael L. Corradini
Chairman


End of excerpts from Nuclear Regulatory Commission
Advisory Committee Correspondence


Read More
tech-R&D Allyn Svoboda tech-R&D Allyn Svoboda

Bats, Birds, Whales & Windpower: U.S. DOE Awards $6.2 Million for Impact Reduction R&D

The projects will develop technology solutions to environmental siting and operational challenges to reduce wind project permitting time and costs.

A trained falcon, equipped with a global positioning system and a very high frequency (VHF) tracker, gathers radar data that is helping scientists improve bird detection technologies at wind facilities. U.S. Department of Energy photo.

A trained falcon, equipped with a global positioning system and a very high frequency (VHF) tracker, gathers radar data that is helping scientists improve bird detection technologies at wind facilities. U.S. Department of Energy photo.

  • Smart curtailment strategies to minimize energy loss from curtailment and wind farm environmental impacts to bats.

  • Bat deterrent technologies to minimize the need for curtailment.

  • Monitoring and mitigation solutions for the offshore wind environment.


The following is a duplicate of a United States Department of Energy announcement.

“Curtailment” is reducing or halting electric power production. For wind-turbone generators, this means stopping blade rotation.


March 13, 2019

Today, the U.S. Department of Energy (DOE) selected nine projects totaing $6.2 million that will reduce environmental compliance costs and environmental impacts of land-based and offshore wind energy.

Funded by the DOE Office of Energy Efficiency and Renewable Energy's Wind Energy Technologies Office, these early-stage research projects are key to development of wind energy as part of DOE's "all-of-the-above" energy strategy. Technologies that reduce the impact to bats, birds and other wildlife can lead to less "curtailment" when wind turbines need to be shut down. In turn, this will lead to greater annual energy production and lower wind energy costs.

The projects will develop technology solutions to environmental siting and operational challenges to reduce wind project permitting time and costs, increase the certainty of project development outcomes, and provide more deployment options at reduced costs.

The $6.2 million will be invested in three areas:

1) Three projects will receive $2.3 million to further the advancement of smart curtailment strategies to minimize energy loss from curtailment and wind farm environmental impacts to bats.

  • Electric Power Research Institute (EPRI), of Palo Alto, California will field-test their new technology which makes automated decisions to curtail wind turbines based on real-time wind speed and bat acoustic data.

  • American Wind Wildlife Institute of Washington, D.C. will develop and evaluate a predictive bat risk model that correlates bat risk with various environmental and weather variables, and integrate this model into a smart curtailment program in wind turbine software.

  • Stantec Consulting Services of Topsham, Maine will develop a predictive model that links measured bat risk factors to the effectiveness of smart curtailment regimes.

2) Three projects will receive $1.4 million to advance the commercial readiness of bat deterrent technologies to minimize the need for curtailment.

  • National Renewable Energy Laboratory of Golden, Colorado will improve the effectiveness of an ultrasonic acoustic deterrent that will keep bats away from wind turbines.

  • General Electric Renewable Energy of Greenville, South Carolina will evaluate the relative effectiveness of ultrasonic deterrence versus wind turbine curtailment for different bat species.

  • Iowa State University of Ames, Iowa will design a passive, blade-mounted ultrasonic bat deterrent device capable of producing a broad spectrum of ultrasonic tones.


3) Three projects will receive $2.5 million to develop and validate pre- and post-construction monitoring and mitigation solutions for the offshore wind environment to ease regulatory barriers to deployment.

October 1, 2016- Heavy seas engulf the Block Island Wind Farm- the first US offshore wind farm. The five GE Haliade 6MW turbines were installed by Deepwater Wind. (Photo by Dennis Schroeder / NREL at flickr.com). Tap-click to enlarge.

  • SMRU Consulting of Friday Harbor, Washington will develop a cost-effective, reliable network of easily-deployed coastal buoys to monitor North Atlantic Right Whales. The project will validate models of noise produced by offshore wind construction activities.

  • Oregon State University of Corvallis, Oregon will design, build, and test an autonomous monitoring system to accurately detect avian and bat collisions with offshore wind turbines. The system will combine microphones and 360º cameras with analysis software to detect and verify impacts.

  • Western EcoSystems Technology of Cheyenne, Wyoming will further develop and test an advanced bat and bird collision detection system which combines turbine blade vibration sensors with cameras to quantify impacts.

With cost-share by the project partners, the projects will total $9.5 million. For more information visit DOE's Wind Energy Technologies Office web site.


U.S. DEPARTMENT OF ENERGY
OFFICE of ENERGY EFFICIENCY & RENEWABLE ENERGY
Forrestal Building
1000 Independence Avenue, SW
Washington, DC 20585

Read More
tech-R&D Allyn Svoboda tech-R&D Allyn Svoboda

Department of Energy Announces $31 Million in Funding To Advance H2@Scale

Goals include affordable hydrogen production for transportation from variable renewable electric power sources.

DOE_H2Scale-logo.png

WASHINGTON, D.C. - March 4, 2019 Today, the U.S. Department of Energy announced up to $31 million in funding to advance the H2@Scale concept. The focus of H2@Scale is to enable affordable and reliable large-scale hydrogen generation, transport, storage, and utilization in the United States across multiple sectors. . . . .

By producing hydrogen when power generation exceeds load, electrolyzers can reduce curtailment of renewables and contribute to grid stability. Hydrogen produced from existing baseload (e.g., nuclear power) assets can also be stored, distributed, and used as a fuel for multiple applications. Such applications include transportation, stationary power, process or building heat, and industrial sectors such as steel manufacturing, ammonia production and petroleum refining. Key challenges to the H2@Scale concept include affordability, reliability, and performance of emerging hydrogen and fuel cell technologies.

Topics under this funding announcement to advance H2@Scale include:

Topic 1: Advanced hydrogen storage and infrastructure R&D (up to $9M) including novel materials or hydrogen carriers for transporting and storing hydrogen, and materials for hydrogen infrastructure components.

Topic 2 : Innovative concepts for hydrogen production and utilization (up to $12M) including advanced water splitting materials, affordable domestic hydrogen production technologies, co-production of hydrogen for additional sources of revenue, and reversible fuel cell technologies.

Topic 3: H2@Scale Pilot - integrated production, storage, and fueling systems (up to $10M) including innovative approaches that successfully integrate and optimize the complete system encompassing hydrogen production, storage, distribution, and use.


Fuel cell energy supply and output. U.S. DOE image.

A fuel cell is a device that uses hydrogen (or hydrogen-rich fuel) and oxygen to create electricity. Fuel cells are more energy efficient than combustion engines and the hydrogen used to power them can come from a variety of sources. If pure hydrogen is used as a fuel, fuel cells emit only heat and water, eliminating concerns about air pollutants or greenhouse gases.


Fuel Cell Components

A single fuel cell. U.S. DOE image.

One of the more common types of fuel cell is the polymer electrolyte membrane (PEM) fuel cell. The PEM fuel cell consists of an electrolyte membrane sandwiched between an anode (negative electrode) and a cathode (positive electrode).


The amount of power produced by a fuel cell depends on several factors, including fuel cell type, cell size, temperature at which it operates, and pressure at which the gases are supplied to the cell. A single fuel cell produces less than 1.16 volts—barely enough electricity for even the smallest applications.

Multiple fuel cells combined into a “stack.” U.S. DOE image.

To increase the amount of electricity generated, individual fuel cells are combined in series, into a fuel cell "stack." A typical fuel cell stack may consist of hundreds of fuel cells.


Fuel cells are a flexible technology and have a broad range of applications.

Transportation

Fuel cells can be used to provide propulsion or auxiliary power for transportation applications including cars, trucks, buses, trains, ships, and submarines. They have been used to provide auxiliary power on spacecraft for decades.

Stationary Power

Stationary fuel cell units can be used for backup power, power for remote locations, stand-alone power plants for towns and cities, distributed generation for buildings, and co-generation (in which excess thermal energy from electricity generation is used for heat).

Portable Power

Fuel cells can be used to power a variety of portable devices, from handheld electronics like cell phones and radios, to larger equipment such as portable generators. They can be used for almost any application typically powered by batteries but can last up to three times longer before refueling.


Read More
tech-R&D Allyn Svoboda tech-R&D Allyn Svoboda

XPRIZE Awards $5 Million for CO2 Capture Tests at Wyoming Powerplant

Winners to test processes for converting powerplant CO2 emissions to useful materials.


Awardees seek to use captured CO2 gas to produce:

  • methanol

  • concrete additives

  • foam-based plastics for insulation and building materials


Test site host utility delivers electricity to 122 local consumer-owned electric utilities:

  • 3 million electric consumers

  • parts of North Dakota, South Dakota, Wyoming, Colorado, Minnesota, Iowa, Nebraska, Montana, and New Mexico.

  • 540,000 square miles of utility service area from the Canadian to the Mexican borders.


Dry Fork Powerplant struck by tornado June 1, 2018.


Dry Fork Generating Station - Gillette, Wyoming. Photo courtesy of Basin Electric Power Cooperative

Dry Fork Generating Station - Gillette, Wyoming. Photo courtesy of Basin Electric Power Cooperative


Five winners of nonprofit XPRIZE Foundation's April 9, 2018 NRG COSIA Carbon XPRIZE $5 million award will use Wyoming's Dry Fork Generation Station Integrated Test Center (ITC) to demonstrate scaled-up versions of their carbon dioxide gas capture and conversion technologies. 

Each team will test the commercial viability for combining carbon-dioxide gas capture from powerplant exhaust with other materials to create useful commercial materials.  The products include methanol, concrete additives, and foam insulation for building construction.  Teams are from India, China, Scotland, Canada, and University of California – Los Angeles (UCLA).

XPRIZE Foundation is headquartered in Culver City, California.


First publication by National Rural Electric Cooperative (NRECA) - Washington, DC.  Written by Derrill Holly, staff writer for NRECA.  Edits, photo captions, and additional info by Linecurrents.

Westminster, Colorado-based Tri-State G&T began developing the concept for a carbon inducement prize and test center eight years ago and has contributed $5 million to the ITC project.  The Wyoming state legislature approved $15 million for ITC construction.  The National Rural Electric Cooperative Association, Washington DC, contributed $1 million.

Bismarck, North Dakota-based Basin Electric is majority owner and operator of Dry Fork Generating Station at Gillette, WY.  Wyoming Municipal Power Agency is co-owner.


Basin Electric (Bismark, ND) generates electricity for local distribution cooperatives in nine West, Midwest and Plains U.S states.  Tri-State Generation and Transmission Association (Westminster, CO) purchases wholesale power from Basin for re-sale to Tri-State's western Nebraska distribution co-ops.

The map shows individual local distribution co-op boundaries.  Larger color-coded areas are generation & transmission associations (G&T's) owned by local co-ops.


Emissions from up to 20 MW of energy production will be diverted to a ported vent system feeding five small test bays and one larger working facility at the ITC.  Researchers will be able to draw CO2 from that waste stream for industrial-scale production use.The five ITC teams will occupy five test bays used by the Carbon XPRIZE finalists, and will share access to flue gas produced by 1.5 MW of generation capacity.

After 10 months of production, XPRIZE judges will consider factors including operational costs, total production and net reduction of CO2 waste as factors in awarding $20 million in final prize money.  Winners from the two test sites will split the proceeds.

The separate large test center can use up to 18.5 MW of flue gas flow.  Kawasaki Heavy Industries, working with the Japan Coal Energy Center on a solid sorbent-based carbon capture technology, is the first tenant for the larger space at the ITC.  Up to $9 million will be spent on the Kawasaki project, which will use sorbent as a low-cost carrier to absorb CO2 for later use as manufacturing feedstocks.

Facilities related to the ITC project now occupy 226,000 square feet of space at the Dry Fork site.

According to the U.S. Energy Information Administration, coal-based electricity generation in the United States produced more than 1.2 million metric tons of CO2 in 2016.  That number accounts for 68 percent of the total CO2 emissions from the energy sector.

Forty-one percent of the power used by electric cooperative members in the United States is produced through coal-based generation.  Co-ops also rely heavily upon natural gas to operate peaking plants, run primarily during periods of high demand.


-- Note:  Ten teams competed for $5 million in XPRIZE awards: five demonstration projects at the Wyoming ITC, and five at Canada's Shepard Energy Centre in Calgary, Alberta where the Alberta Carbon Conversion Technology Centre is fueled by natural gas.

Alberta will conduct production scale testing on plastics, concrete alternatives, new building compounds and nanoparticles for use in bioplastics and other products. --


Read More
EVs, tech-R&D Allyn Svoboda EVs, tech-R&D Allyn Svoboda

Long-Distance EV Driving - Field Reports

Electric cooperative employees tell their battery-charging stories . . .


Fast chargers prevent frequent naps


Parking lot EV charging station at Montrose, Colo. Aug. 2017 - Linecurrents photo


“Charging presents a challenge. . . . Ready access to public charging is not commonplace in rural areas.”  -  Alan Shedd, director of energy solutions for Touchstone Energy Cooperatives.


1st publication - June 5, 2018
by National Rural Electric Cooperative Association
Arlington, Virginia
Author: Derrill Holly - staff writer


Shedd was among the co-op staffers who spent several days in May learning firsthand about the challenges facing motorists traveling long distances in electric cars. While electric vehicles are gaining popularity for commuter use, with home and workplace charging options becoming more common, experience with long-range travel remains limited.

Mike Smith (The Electric Cooperatives of South Carolina) and his son Colin, 16, drove a Chevy Bolt from Cayce, South Carolina, to Salt Lake City by way of Interstate 80. . . .

“The route we chose had everything to do with charging availability and avoiding the mountains if we could. . . . we had trouble doing 300 to 400 miles a day through Nebraska and Wyoming because of the lack of fast chargers,” said Smith.  “. . .  we can get a Level I charge from a standard 20 amp 120 volt outlet, delivering a paltry five miles of driving range per hour. At that rate, a full charge would take about 46 hours for our car.”

In Wyoming, they used a 240-volt dryer outlet to charge the car at one stop and a 50 amp campground power pedestal at another.


Our days and nights got mixed up . . . when the car needed a charge we stopped and slept while the car was charging.

Direct current fast chargers (DCFC) operate at high power outputs of between 20 and 150 kilowatts, said Smith. “The fastest we have been able to charge the Bolt is 45 kW, which adds 170 miles of range per hour of charging. If a DCFC is not available, our next choice is a Level II charger, which adds between 20 and 30 miles of range per hour.”

“We could drive for about three hours and then we had to charge for six,” said Colin Smith. “Our days and nights got mixed up towards the end. When the car was fully charged, we went; but when the car needed a charge we stopped and slept while the car was charging.”


Two employees of Melrose, Minnesota-based Stearns Electric Association made much better time in a Tesla Model S, in part because they had access to Tesla’s fast-charging network.

Amanda Groethe and Whitney Ditlevson . . . made the 1,216-mile trip to Salt Lake City with just nine recharging stops, and none of those lasted more than two hours.

With planning, they were able to time charging stops to coincide with meal breaks or sight-seeing, and the Tesla charging stations were always conveniently nearby.

“Generally the Tesla was fully charged by the time we were done with everything we wanted to do,” said Groethe.


Teams from Montana and Colorado also completed the trip, but William Boyd Lee, vice president of strategic planning at CKEnergy, faced big challenges trying to get his Chevy Bolt from Binger, Oklahoma, to Salt Lake City.

“Charging facilities west of Oklahoma City and up to Albuquerque, New Mexico are very lacking,” said Lee, who blogged about facing frustrating detours and charging equipment performance issues, in Amarillo, Texas.

Lee and his son, Jay, 27, decided to tow his EV to Salt Lake City from Oklahoma with a gasoline-fueled F150 pickup truck. . . .


Read More
tech-R&D Allyn Svoboda tech-R&D Allyn Svoboda

Kodiak AK Utility Powered by 98% Hydro & Windpower

Abundant water for hydroelectric power.   Windpower turbines added to reduce diesel fuel burned in generators.

Wind turbines in Kodiak, Alaska. Photo by Science in HD on Unsplash


Kodiak, Alaska is an of-the-grid community.  The location is Kodiak Island, separated from the mainland.  Kodiak Electric Association (KEA) is not connected to other utilities by high-voltage transmissson lines.  Alaska is too big for electric utilities to share power from generating stations.

KEA must generate all of its customers' electric power needs locally.  Hydropower installed in the 1970s was adequate for a few decades, until growth required adding diesel-fueled generators.  PBS Newshour reports from Kodiak, describing why and how Kodiak Electric reduced diesel fuel consumption for generating electricity, added wind turbine generators, and installed big batteries to store windpower.

This year, through September 28, 98% of KEA's power supply has been generated by non-fossil-fuel sources, according to data at KEA's website. Hydroelectric supplies most of the power requirements, followed by windpower and diesel engines (see chart at bottom.)

Pillar Mountain Wind consists of six turbines rated 1.5 MW each.  Terror Lake Hydroelectric has three turbines with a combined capacity of 30 MW.  The combined system has two forms of energy storage: batteries, and water behind a dam.

When the wind stops blowing, a 3 MW battery bank automatically switches-online until the the hydroelectric power generators adjust to increase their power output.

PBS Newshour describes a potential electric power problem arose when a shipping facility at Kodiak's port planned to replace an old engine-driven crane with a new electric crane.  As the crane lifts a heavy container from dock up to a cargo ship deck, the crane's electric motor draws a large amount of electric power.  When the crane lowers, the descending weight provides mechanical energy to the motor, causing the motor to generate power which could flow back onto the local powerline.  This cycling would disturb the power quality of the electric line supplying service to other customers by causing voltage swings.

To smooth the power variations before they happen, KEA and the shipping customer installed and connected a flywheel to the powerline.  The flywheel spins continuously when a ship is loaded so that its rotational momentum will supply energy when needed.  When the crane lifts cargo, some of the flywheel energy is converted to electric power.  During crane descent, the flywheel absorbs electric energy from the motor by converting the excess electric power to mechanical rotating energy.  KEA told LineCurrents that the crane and flywheel controls communicate via fiberoptic cable, assuring that the flywheel reacts quickly to inject or absorb electric power.

Links

KEA 2017 Electric Power Supply - megaWatthors

year-to-date September 28, 2017


  • MW-hrs: megaWatt-hours

  • One megaWatt-hour equals 1,000 kiloWatt-hours

Read More